Greenwich’s New 3 Speed Property Market

181 v1

“What’s happening to the Greenwich Property Market” is a question I am asked repeatedly.  Well, would it be a surprise to hear that my own research suggests that there isn’t just one big Greenwich property market – but many small micro-property markets?

According to recent data released by the Office of National Statistics (ONS), I have discovered that at least three of these micro-property markets have emerged over the last 20+ years in the borough.

For ease, I have named them the …

  1. lower’ Greenwich Property Market.
  2. lower to middle’ Greenwich Property Market.
  3. ‘middle’ Greenwich Property Market.

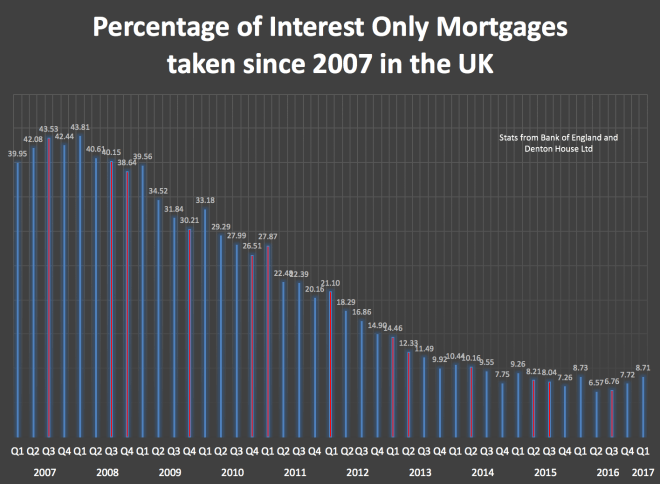
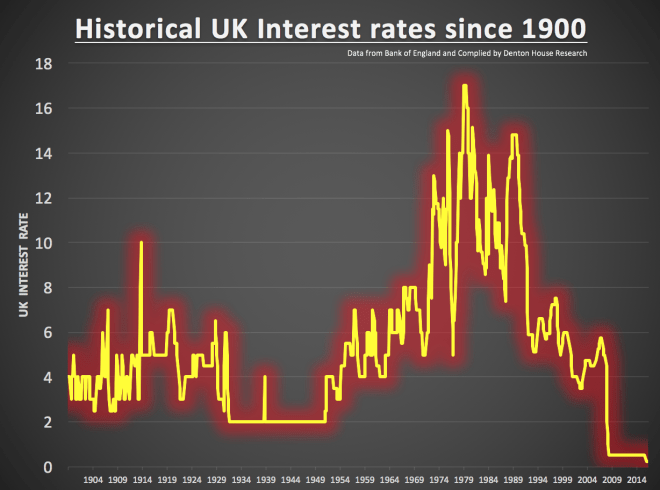
The ‘lower’ and ‘lower to middle’ sectors of the Greenwich property market have been fuelled over the last few years by two sets of buyers. The first set, making up the clear majority of those buyers, are cash rich landlord investors who are throwing themselves into the Greenwich property market to take advantage of alluringly low prices and even lower interest rates. The other set of buyers in the ‘lower’ and ‘lower to middle’ Greenwich property market are the first-time buyers (FTB), although the FTB market is in a state of unparalleled deadlock as it’s been trampled into near-immobility and incapacity by the new 2014 stricter mortgage affordability regulations and also fewer mortgages with low deposits.

Some of you may be interested to know how I have classified the three sectors ..

  1. lower’ Greenwich housing market – the bottom 10% (in terms of value) of properties sold
  2. lower to middle’ Greenwich housing market – lower Quartile (or lowest 25% in terms of value) of properties sold
  3. middle’ Greenwich housing market – which is the median in terms of value

…. and if one looks at the figures for Greenwich London Borough Council area you can see the three different sectors (lower, lower/middle and middle) have performed quite differently.

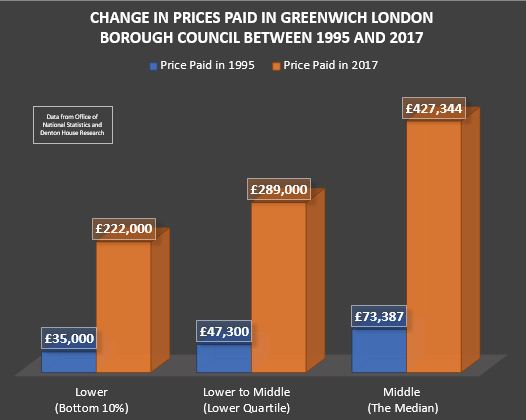
Greenwich London Borough Council Property Market – Sold Prices

Price Paid in 1995 Price Paid in 2017 Percentage Uplift 1995 – 2017

Lower (Bottom 10%)

£35,000 £222,000 534.29%

Lower to Middle (Lower Quartile)

£47,300

£289,000 510.99%

Middle (The Median)

£73,387 £427,344

482.31%

You can quite clearly see that it is the ‘lower” market that has performed the best.

Capture 1

Capture 2

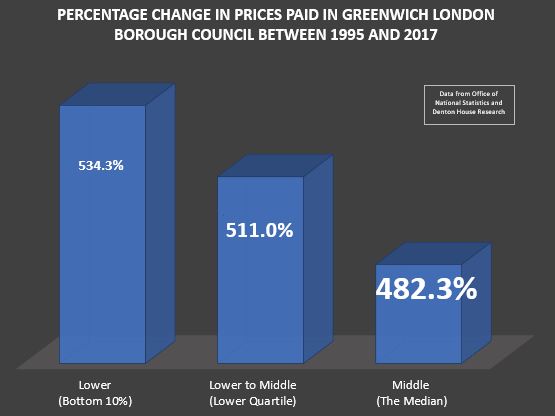
You might ask, what do all these different figures mean to homeowners and landlords alike?  Quite a lot – so let me explain. The worst performing sector (with the lowest Percentage uplift) was the ‘middle’ housing market. Therefore, interestingly, if we applied the best percentage uplift figure (i.e. from the ‘lower’ market percentage uplift), to the ‘middle’ 1995 housing market figure, the 2017 figure of £427,344, would have been £448,387 instead – quite a difference you must agree?

Now, I have specifically not mentioned the upper reaches of the Greenwich housing market for several reasons.  Firstly, the lower or middle market is where most of the buy to let investment landlords buy their property and where the majority of property transactions take place. Secondly, due to the unique and distinctive nature of Greenwich’s up-market property scene (because every property is different and they don’t tend to sell as often as the lower to middle market), it is much more difficult to calculate what changes have occurred to property prices in that part of the Greenwich property market – looking at the stats for the up-market Greenwich property market from Land Registry, only 30 properties in Greenwich (and a 1 mile radius around it) have sold for £3,000,000 or more since 1997.

So, what should every homeowner and buy to let landlord take from the information that there are many micro-property markets? Well, when you realise there isn’t just one Greenwich Property Market, but many Greenwich “micro-property markets”, you can spot trends and bag yourself some potential bargains. Even in this market, I have spotted a number of bargains over the last few months that I have shared in my Property Blog and to my landlord database, especially in the ‘lower’ and ‘lower/middle’ market. If you want to be kept informed, have a look at my blog https://greenwichpropertyblog.co.uk/ .. it’s free to do so and I’m sure you wouldn’t want to miss out – would you?

I would love to know if you have spotted any micro-property markets in Greenwich.


Supply and Demand Issues mean Greenwich Property Values Drop by 1.7% in the Last 12 Months

182 fixed graph on land usage

The most recent set of data from the Land Registry has stated that property values in Greenwich and the surrounding area were 1.78% lower than 12 months ago but 16.45% higher than January 2015.

Despite the uncertainty over Brexit as Greenwich (and most of the UK’s) property values continue their medium and long-term upward trajectory. As economics is about supply and demand, the story behind the Greenwich property market can also be seen from those two sides of the story.

Looking at the supply issues of the Greenwich property market, putting aside the short-term dearth of property on the market, one of the main reasons of this sustained house price growth has been down to of the lack of building new homes.

The draconian planning laws, that over the last 70 years (starting with The Town and Country Planning Act 1947) has meant the amount of land built on in the UK today, only stands at 1.8% (no, that’s not a typo – its one point eight percent) and that is made up of 1.1% with residential property and 0.7% for commercial property. Now I am not advocating building modern ugly carbuncles and high-rise flats in the Cotswolds, nor blot the landscape with the building of massive out of place ugly 1,000 home housing estates around the beautiful areas of Greenwich Park.

The facts are, with the restrictions on building homes for people to live in, because of these 70-year-old restrictive planning regulations, homes that the youngsters of Greenwich badly need, aren’t being built. Adding fuel to that fire, there has been a large dose of nimby-ism and landowners deliberately sitting on land, which has kept land values high and from that keeps house prices high.

Looking at the demand side of the equation, one might have thought property values would drop because of Brexit and buyers uncertainty. However, certain commenters now believe property values might rise because of Brexit. Many people are risk adverse, especially with their hard-earned savings. The stock market is at an all-time high (ready to pop again?) and many people don’t trust the money markets. The thing about property is its tangible, bricks and mortar, you can touch it and you can easily understand it.

The Brits have historically put their faith in bricks and mortar, which they expect to rise in value, in numerical terms, at least. Nationally, the value of property has risen by 635.4% since 1984 whilst the stock market has risen by a very similar 593.1%. However, the stock market has had a roller coaster of a ride to get to those figures. For example, in the dot com bubble of the early 2000’s, the FTSE100 dropped 126.3% in two years and it dropped again by 44.6% in 9 months in 2007… the worst drop Greenwich saw in property values was just 16.88% in the 2008/9 credit crunch.

Despite the slowdown in the rate of annual property value growth in Greenwich (to the current drop of 1.78%), from the heady days of 23.24% annual increases seen in mid 2014, it can be argued the headline rate of Greenwich property price inflation is holding up well, especially with the squeeze on real incomes, new taxation rules for landlords and the slight ambiguity around Brexit. With mortgage rates at an all-time low and tumbling unemployment, all these factors are largely continuing to help support property values in Greenwich (and the UK).

For more thoughts on the Greenwich Property Market, please visit the Greenwich Property Market Blog. greenwichpropertyblog.co.uk

Greenwich Homeowners and their £1.23 billion Debt

Over the last 12 months, the UK has decided to leave the EU, have a General Election with a result that didn’t go to plan for Mrs May and to add insult to injury, our American cousins elected Donald Trump as the 45th President of the United States. It could be said this should have caused some unnecessary unpredictability into the UK property market.

The reality is that the housing and mortgage market (for the time being) has shown a noteworthy resilience. Indeed on the back of the Monetary Policy pursued by the Bank of England there has been a notable improvement of macro-economic conditions! In July for example it was announced that we are witness to the lowest levels of unemployment for nearly 50 years. Furthermore, despite the UK construction industry building 21% more properties than same time the previous year, there has still been a disproportionate increase in demand for housing, particularly in the most thriving areas of the Country. Repossessions too are also at an all-time low at 3,985 for the last Quarter (Q1 2017) from a high of 29,145 in Q1 2009. All these things have resulted in…

Property values in Greenwich according to the Land Registry are 1.78% lower than a year ago

So, what does all this mean for the homeowners and landlords of Greenwich, especially in relation to property prices moving forward?

One vital bellwether of the property market (and property values) is the mortgage market. The UK mortgage market is worth £961,653,701,493 (that’s £961bn) and it representative of 13,314,512 mortgages (interestingly, the UK’s mortgage market is the largest in Europe in terms of amount lent per year and the total value of outstanding loans). Uncertainty causes banks to stop lending – look what happened in the credit crunch and that seriously affects property prices.

Roll the clock back to 2007, and nobody had heard of the term ‘credit crunch’, but now the expression has entered our everyday language.  It took a few months throughout the autumn of 2007, before the crunch started to hit the Greenwich property market, but in late 2007, and for the following year and half, Greenwich property values dropped each month like the notorious heavy lead balloon, meaning …

The credit crunch caused Greenwich property values to drop by 16.8%

Under the sustained pressure of the Credit Crunch, the Bank of England realised that the UK economy was stalling in the early autumn of 2008. Loan book lending (sub-prime phenomenon) in the US and across the world was the trigger for this pressure. In a bid to stimulate the British economy there were six successive interest rates drops between October 2008 and March 2009; this resulted in interest rates falling from 5% to 0.5%!

Thankfully, after a period of stagnation, the Greenwich property market started to recover slowly in 2011 as certainty returned to the economy as a whole and Greenwich property values really took off in 2013 as the economy sped upwards. Thankfully, the ‘fire’ was taken out of the property market in Spring 2015 (otherwise we could have had another boom and bust scenario like we had in the 1960’s, 70’s and 80’s), with new mortgage lending rules. Throughout 2016, we saw a return to more realistic and stable medium term property price growth. Interestingly, property prices recovered in Greenwich from the post Credit Crunch 2009 dip and are now 84.6% higher than they were in 2009.

Chart 1

Now, as we enter the summer of 2017, with the Conservatives having been re-elected on their slender majority, the Greenwich property market has recouped its composure and in fact, there has been some aggressive competition among mortgage lenders, which has driven mortgage rates down to record lows. This is good news for Greenwich homeowners and landlords, over the last few months a mortgage price war has broken out between lenders, with many slashing the rates on their deals to the lowest they have ever offered.  For example, last month, HSBC launched a 1.69% five-year fixed mortgage!

Interestingly, according to the Council of Mortgage Lenders, the level of mortgage lending had soared to an all-time high in the UK.

In the Greenwich postcode of SE10, if you added up everyone’s mortgage, it would total £1,231,860,236!

Since 1977, the average Bank of England interest rate has been 6.65%, making the current 323 year all time low rate of 0.25% very low indeed. Thankfully, the proportion of borrowers fixing their mortgage rate has gone from 31.52% in the autumn of 2012 to the current 59.3%. If you haven’t fixed – maybe you should follow the majority?

In my modest opinion, especially if things do get a little rocky and uncertainty seeps back in the coming years (and nobody knows what will happen on that front), one thing I know is for certain, interest rates can only go one way from their 300 year ultra 0.25% low level … and that is why I consider it important to highlight this to all the homeowners and landlords of Greenwich. Maybe, just maybe, you might want to consider taking some advice from a qualified mortgage adviser? There are plenty of them in Greenwich

If you are interested in the Greenwich Property Market, you might learn something by visiting the blog. greenwichpropertyblog.co.uk


Greenwich Property Market and Mysterious Politics of the General Election

180 graphic v3

As the dust starts to settle on the various unread General Election party manifestos, with their ‘bran-bucket’ made up numbers, life goes back to normal as political rhetoric on social media is replaced with pictures of cats and people’s lunch.  Joking aside though, all the political parties promised so much on the housing front in their manifestos, should they be elected at the General Election.  In hindsight, irrespective of which party, they seldom deliver on those promises.

Housing has always been the Cinderella issue at General Elections.  Policing, NHS, Education, Tax and Pensions etc., are always headline grabbing stuff and always seem to go ‘the ball’. However, housing, which affects all our lives, always seems to get left behind and forgotten.

Nonetheless, the way the politicians act on housing can have a fundamental effect on the wellbeing of the UK plc and the nation as a whole.

One policy that comes to mind is Margaret Thatcher’s Council House sell off in the 1980’s, when around 1.4m council houses went from public ownership to private ownership.  It was a great vote winner at the time (it helped her win three General Elections in a row) but it has meant the current generation of 20 somethings in Greenwich (and elsewhere in the Country) don’t have that option of going into a council house.  This has been a huge contributing factor in the rise of the private renting and buy to let in Greenwich over the last 15 years.

Nevertheless, looking back to the start of the Millennium, Labour set the national target for new house building at 200,000 new homes a year (and at one point that increased to 240,000 under Gordon Brown for a couple of years).  In terms of what was actually built, the figures did rise in the mid Noughties from 186,000 properties built in 2004 to an impressive 224,000 in 2007 (the highest since the early 1980’s) as the economy grew.

Then the Credit Crunch hit.  It is interesting, that the 2010 Cameron/Clegg government did things a little differently.  The fallout of the Credit Crunch meant a lot less homes were built, so instead of tackling that head on, the coalition side-stepped the target of the number of new homes to build and offered a £400m fund to help kick start the housing market (a figure that was a drop in the ocean when you consider an average UK property was worth around £230,000 in 2010).  The number of new houses being completed dipped from 146,800 in 2011 to 135,500 the subsequent year.

So, one might ask exactly how many new homes do we need to build per year?  It is commonly accepted that not enough new properties are being built to meet the rising need for homes to live in.  A report by the Government in 2016, showed that on average 210,000 net additional households will be formed each year) up to 2039 (through increased birth rates, immigration, people living longer, lifestyle (i.e. divorce) and people living by themselves more than 30 years ago).  In 2016, only 140,600 homes were built … simply not enough!

Capture

Looking at the numbers locally in Greenwich and the surrounding area, it is obvious to me, that we as an area, are not pulling our weight either when it comes to building new homes. Although, in the 12 months up to the end of Q1 2017, 1,560 properties were built in the London Borough of Greenwich Council area, we may still need to do better.  Go back to 2007, that figure was 1,130, 10 years before that in 1997, 230 new homes and further back to 1988, 180 new homes were built.

Who knows if Teresa May’s Government will last the five years?  She will think she has bigger fish to fry with Brexit to get bogged down with housing issues.  But let me leave you with one final thought.


The conceivable rewards in providing a place to live for the public on a massive house building programme can be enormous, as previous Tory PM’s have found out.  Winston Churchill in 1951, asked his Minister for Housing (Harold Macmillan) if he could guarantee the construction of 300,000 new properties a year, he was notoriously told: “It is a gamble—it will make or mar your political career, but every humble home will bless your name if you succeed.”

Isn’t it interesting, that the Tories remained in power until 1964!  Mrs May will have to work out if she wants to be the heiress to Harold Macmillan or David Cameron?

Greenwich’s 765 Mortgage Time-Bombs?

178 v2According to my research, of the 10,819 properties in Greenwich, 3,541 of those properties have mortgages on them. 71.1% of those mortgaged properties are made up of owner-occupiers and the rest are buy to let landlords (with a mortgage).

… but this is the concerning part .. 765 of those Greenwich mortgages are interest only. My research also shows that, each year between 2017 and 2022, 9 of those households with interest only mortgages will mature, and of those, 2 households a year will either have a shortfall or no way of paying the mortgage off. Now that might not sound a lot – but it is still someone’s home that is potentially at risk.

Capture 1

Theoretically this is an enormous problem for anyone in this situation as their home is at risk of repossession if they don’t have some means to repay these mortgages at the end of the term (the typical term being 25 to 35 years). Banks and Building Societies are under no obligation to lengthen the term of the mortgage and, when deciding whether they are prepared to do so or not, will look at it in the same way as someone coming to them for a new mortgage.

Back in the 1970’s and 1980’s, when endowment mortgages were all the rage, having an endowment meant you were taking out an interest only mortgage and then paying into an endowment policy which would pay the mortgage off (plus hopefully leave some profit) at the end of the 25/35-year term. There were advantages to that type of mortgage as the monthly repayments were lower than with a traditional capital repayment and interest mortgage. Only the interest, rather than any capital, is paid to the mortgage company – but the full debt must be cleared at the end of the 25/35-year term.

Historically plenty of Greenwich homeowners bought an endowment policy to run alongside their interest only mortgage. However, because the endowment policy was a stock market linked investment plan and the stock market poorly performed between 1999 and 2003 (when the FTSE dropped 49.72%), the endowments of many of these homeowners didn’t cover the shortfall. Indeed, it left them significantly in debt!

Nonetheless, in the mid 2000’s, when the word endowment had become a dirty word, the banks still sold ‘interest only’ mortgages, but this time with no savings plan, endowment or investment product to pay the mortgage off at the end of the term. It was a case of ‘we’ll sort that nearer the time’ as property prices were on the rampage in an upwards direction!

Thankfully, the proportion of interest only mortgages sold started to decline after the Credit Crunch, as you can see looking at the graph below, from a peak of 43.81% of all mortgages to the current 8.71%

178 fixed graph - just cut and paste in

Increasing the length of the mortgage to obtain more time to raise the money has gradually become more difficult since the introduction of stricter lending criteria in 2014, with many mature borrowers considered too old for a mortgage extension.

Greenwich people who took out interest only mortgages years ago and don’t have a strategy to pay back the mortgage face a ticking time bomb. It would either be a choice of hastily scraping the money together to pay off their mortgage, selling their property or the possibility of repossession (which to be frank is a disturbing prospect).

I want to stress to all existing and future homeowners who use mortgages to go in to them with your eyes open. You must understand, whilst the banks and building societies could do more to help, you too have personal responsibility in understanding what you are signing yourself up to. It’s not just the monthly repayments, but the whole picture in the short and long term. Many of you reading my blog ask why I say these things. I want to share my thoughts and opinions on the real issues affecting the Greenwich property market, warts and all. If you want fluffy clouds and rose tinted glasses articles – then my articles are not for you. However, if you want someone to tell you the real story about the Greenwich property market, be it good, bad or indifferent, then maybe you should start reading my blog regularly.

For more thoughts on the Greenwich Property Market – visit the Greenwich Property Blog on https://greenwichpropertyblog.co.uk.

Greenwich Baby Boomers vs. Greenwich Millennials (Part 2)

177 graphic 2

Well last week’s article “The Unfairness of the Greenwich Baby Boomer’s £16,246,990,000 windfall?” caused a stir. In it we looked at a young family member of mine who was arguing the case that Millennials (those born after 1985) were suffering on the back of the older generation in Greenwich. They claimed the older generation had seen the benefit of the cumulative value of Greenwich properties significantly increasing over the last 25/30 years (which I calculated at  £16.25bn since 1990). In addition many of the older generation (the baby boomers) had fantastic pensions, which meant the younger generation were priced out of the Greenwich housing market.

I replied there should be no surprise though that the older members of our society hold considerably more of our country’s wealth than the younger generation. This wealth is accrued and saved across someone’s life, and reaches it’s peak about the time of retirement. If we are to comprehend differing wealth levels between generations we need to compare ‘apples with apples’. It is much more important to track the wealth held by different generations at the same age, i.e. what was ‘real’ wealth of the 30-something couple in the 1960’s compared to a 30-something couple say in the 1980’s or 2010’s?

Looking back over the last 120 years at various economic studies, this growth in wealth from one generation to the next (at the age range), only happened over a 30 year period of between 1960 and late 1980’s. Since the 1990’s, wealth has not improved across the generations, in the same age range.

So could it be all about these people saving? The fact is, in the last 10 years, UK households have saved on average 7.5% to 8% of the household income into savings accounts, compared to an average of 6% to 7% in the late 1960’s and 1970’s. The baby boomers haven’t been actively squirreling away their cash for the last 30 or 40 years in savings accounts to accumulate their wealth. Most of their gains have been passive, lucky bonuses gained on the back of things out of their control (unanticipated and massive property value rises or people living longer making final salary pensions more valuable) – it’s not their fault!

…and herein lies the issue … it is assumed that these Millennials aren’t buying property in the same numbers like the older generation did in the past (because most of their wealth has come from house price inflation). The Millennials have often been described as ‘Generation Rent’, because they rent as opposed to buying property – because we are told they cant buy.


However, when Greenwich mortgage payments are measured against monthly income, home ownership is affordable by historic standards because mortgage rates are currently so low. As you can see, the ratio of average house price to average earnings in Greenwich hasn’t vastly changed over the last decade …

GR1

  • 2008 average house price to average earnings of a single person in Greenwich 8.21 to 1
  • 2017 average house price to average earnings of a single person in Greenwich 12.4 to 1


(i.e. in 2008, the average house price in Greenwich was 8.21 times more than the average person’s salary in Greenwich and this has only risen to 12.4 in 2017 – and all this off the property boom of the early 2010’s)

95% first-time buyer mortgages were reintroduced in 2010. The average interest rate charged for those 95% FTB mortgages has slowly dropped from around 5.5% in 2009 to the current 4% rate. Back in the 1980’s/1990’s mortgage interest rates were between 8% and 10%, and one time in the early 1990’s, reached 15%! The main difference between the two periods was the absolute borrowing relative to income is greater now than in the 1980’s. They call this the ‘mortgage to joint household income ratio’. In the 1980’s the mortgage was between 1.8x to 2x joint income; today it is 3.4x to 3.6x salary.

The simple fact is, in the majority of cases, it is still cheaper for a first-time buyer to buy a property with a 95% mortgage, than it is rent it. The barrier for these Millennials, has to be finding the 5% mortgage deposit – instead of being able to afford monthly mortgage outgoings at the current 95% mortgage rates?

Millennials make up 24,695 households in the Greenwich London Borough Council area (or 24.4% of all households in the area).  However, behind the doom and gloom, surprisingly, 25.8% did save up the 5% deposit and do in fact own their own home.

Nonetheless, the majority of Millennials in the area still do rent from a landlord (10,624 Millennial households to be exact). Yet, they have a choice. Buckle down and do what their parents did and go without the nice things in life for a couple of years (i.e. the holidays, out on the town two times a week, the annual upgraded mobile phones, the £100 a month Satellite packages) and save for a 5% mortgage deposit … or live in a lovely rented house or apartment (because they are nowadays), without any maintenance bills and live a life with no intention of buying (because renting doesn’t have a stigma anymore like it did in the 1960’s/70’s (secretly hoping their parents don’t spend all their inheritance so they can buy a property later in life – like they do in central Europe).

Neither decision is right or wrong – although it is still a choice. Until Millennials decide to change their choices – that is the reason why the country’s private rental sector will continue to grow for the next 30 years – meaning happy tenants and happy landlords.

The Unfairness of the Greenwich Baby Boomer’s £16,246,990,000 Windfall? (Part 1)

176 graphic 1

Recently I was having a chat with one of my second cousins at a big family get-together. The last time I had seen them their children were in their early teens. Now their children are all grown up, have partners, dogs and children. Wow – how time flies!

So, I got talking over a glass of lemonade with my 2nd cousins and a couple of their children, about the times of 15% interest rates and how the more mature members of our family had to endure the 3 day week, 20% inflation and the threat of nuclear annihilation in 4 minutes .. so, foolishly, I said what with all the opportunities youngsters had today, they had never had it so good!

Trust one of my cousin’s children to have gained some financial/economics qualifications before going to Law School, as they debated with me the genuine economic predicament of Millennials and how a combination of student debt, unemployment, global proliferation, EU migration and rising house values is reducing the salaries and outlook of masses of the UK’s younger generation, causing an unparalleled disparity of wealth between the generations. So of course I asked why that was?

They said Millennials were paying the price for the UK’s most spectacular bookkeeping catastrophe to date (bigger than the Bank bailout after the Credit Crunch). Back in the 1950’s and 1960’s, nobody predicted us Brit’s would live as long as we do today, and in such abundant numbers. The OAP pensions that were promised in the past (be that Government State Pension or Company Final Salary Schemes) which appeared to be nothing fancy at the time, are now burdensomely over-lavish, and that is hurting the Millennials of today and will do so for years to come.

Bringing it back to property, the young 2nd cousin once removed ‘soon to be’ lawyer, stated that baby boomers born between 1945 and 1965 have been big recipients of the vast rising house prices over the 1970’s/80’s/90’s and 2000’s. Add to that their decent pensions, meaning cumulatively, their wealth has grown exponentially through no skill of their own.

This disparity of wealth between the older and younger generations could have unparalleled consequences for the living standards of younger Millennials…. So Houston Greenwich – do we have a problem??

Well Greenwich Property Blog readers, you know I like a challenge. I can’t disagree with some of what the younger family member said, but there are always two sides to every story, so I thought I would do some homework on the matter.


GR1

Since 1990, the average value of a property in Greenwich has risen from £112,800 to its current level of £592,600. As there are a total of 33,862 homeowners aged over 50 in Greenwich; that means there has been a £16.25bn windfall for those Greenwich homeowners fortunate enough to own their own homes during the property boom of the 1990s and early 2000’s.

I must admit that the growth in property values in the 1990’s and 2000’s certainly helped many of Greenwich’s baby boomers. The figures do appear to put into reverse gear the perceived wisdom that each generation gets wealthier than the previous one  … and so with all this wealth, the figures do back up the youngsters argument that Millennials are being priced out of home ownership.

Or do they? Are they?

Next week, I will carry on this discussion where I will give the Baby Boomer’s defence to the prosecution’s case!

Greenwich First Time Buyers Mortgages taking 46.1% of their Wages

I received a very interesting letter the other day from a Greenwich resident. He declared he was a Greenwich homeowner, retired and mortgage free. He stated how unaffordable Greenwich’s rising property prices were and that he worried how the younger generation of Greenwich could ever afford to buy? He went on to ask if it was right for landlords to make money on the inability of others to buy property and if, by buying a buy to let property, Greenwich landlords are denying the younger generation the ability to in fact buy their own home.

Whilst doing my research for my many blog posts on the Greenwich Property Market, I know that a third of 25 to 30 year olds still live at home. It’s no wonder people are kicking out against buy to let landlords; as they are the greedy bad people who are cashing in on a social woe. In fact, most people believe the high increases in Greenwich’s (and the rest of the UK’s) house prices are the very reason owning a home is outside the grasp of these younger would-be property owners.

However, the numbers tell a different story. Looking of the age of first time buyers since 1990, the statistics could be seen to pour cold water on the idea that younger people are being priced out of the housing market. In 1990, when data was first published, the average age of a first time buyer was 33, today it’s 31.

Nevertheless, the average age doesn’t tell the whole story. In the early 1990’s, 26.7% of first-time buyers were under 25, while in the last five years just 14.9% were. In the early 1990’s, four out of ten first time buyers were 25 to 34 years of age and now its six out of ten first time buyers.

Although, there are also indications of how un-affordable housing is, the house price-to-earnings ratio has almost doubled for first-time buyers in the past 30 years. In 1983, the average Greenwich home cost a first-time buyer (or buyers in the case of joint mortgages) the equivalent of 3.1 times their total annual earnings, whilst today, that has escalated to 7.1 times their income.

Again, those figures don’t tell the whole story. Back in 1983, the mortgage payments as percentage of mean take home pay for a Greenwich first time buyer was 32.8%. In 1989, that had risen to 84.6%. Today, it’s 46.1% … and no that’s not a typo .. 46.1% is the correct figure.

So, to answer the gentleman’s questions about the younger generation of Greenwich being able to afford to buy and if it was right for landlords to make money on the inability of others to buy property? It isn’t all to do with affordability as the numbers show.171 graphic v2

And what of the landlords? Some say the government should sort the housing problem out themselves, but according to my calculations, £18bn a year would need to be spent for the next 20 or so years to meet current demand for households. That would be the equivalent of raising income tax by 4p in the Pound. I don’t think UK tax payers would swallow that.

So, if the Government haven’t got the money… who else will house these people? Private Sector Landlords and thankfully they have taken up the slack over the last 15 years.

Some say there is a tendency to equate property ownership with national prosperity, but this isn’t necessarily the case. The youngsters of Greenwich are buying houses, but buying later in life. Also, many Greenwich youngsters are actively choosing to rent for the long term, as it gives them flexibility – something our 21st Century society craves more than ever.

The Greenwich Property Market, The Beatles, Sweden and 50 year mortgages

175 graphic 3

50 years ago, in 1967, the first human heart transplant was performed by Dr Christian Barnard in South Africa. In the same year Sweden switched from driving on the left-hand side to the right-hand side of the road. The average value of a Greenwich property was £7,858, interest rates were at 5.5% and The Beatles released one of my favourite albums – their Sgt Peppers album … but what the hell has that to do with the Greenwich property market today?? Quite a lot actually … so with my CD Player turned up loud – let me explain my friends!

I have been doing some research on the current attitude of Greenwich first-time buyers. First-time buyers are so important for both landlords and homeowners. If first-time buyers aren’t buying, they still need a roof over their heads, so they rent (good news for landlords). If they buy, demand for Greenwich property goes up for starter homes and that enables other Greenwich homeowners to move up the property ladder.

First-time buyers are the life blood of the property market. They are, however the most susceptible to interest rate rises and the affordability of mortgages. With that in mind, let us see what is happening to them…

The average value of a Greenwich property is currently standing at £592,563 and UK interest rates at 0.25%. As each year goes by, it appears the age of the everlasting mortgage has started to emerge, prompted by these first-time buyers, eager to get a foot on the housing ladder. I was reading a report a few days ago where some mortgage companies confessed that the battle to gain big returns from the property market has led to mortgages that will take considerably longer than the customary 25 years to pay off.

Over the last few years, it has been commonplace for first-time buyer mortgages to be 30 and 35 years in length as the ‘Bank of Mum and Dad’ have been helping with the deposit (Beatles Sgt Pepper song – “With a Little Help from My Friends”). Now, some high street banks are offering mortgage terms of 40 years. This means first-time buyers could be paying until their mid 60’s – I can hear that other great track from the same album “When I’m Sixty-Four” ringing in my ears! So, a 50-year mortgage does not seem as far-fetched now as it would have been back in the 1970’s. After all life expectancy for a male then was exactly 69 years and today its 79 years and 5 months!

Over the last ten years, Greenwich property prices have continued to rise more than wages, therefore, first-time buyers are looking for bigger loans. If this development continues, the only way repayments can remain reasonable is by increasing the term of the loan.

However, some commentators have said there are worries the mortgage companies are lending money over such a long term, they threaten leaving some first-time buyers with a generation of debt if the house price bubble bursts. Interestingly, when I looked at what had happened to average property values in Greenwich over the last 50 years, there have been bubbles. First-time buyers should take heart, since as a county we have always recovered from it a few years later.

1755

What if interest rates rise? Well looking at historic UK interest rates, the current rate of 0.25% is at a 300-year low. Mortgages will never be cheaper. I would however, seriously consider fixing the rate to cushion any future potential interest rate rises (since they can only go in one direction when they do change). If Greenwich first-time buyers see buying a home as a long-term decision, based on the last 50 years, they should be just fine!

17555

Before I go, a final thought for property buyers in Sweden, the land of Volvo and Abba. As Swedish property prices are so high, Swedish Regulators announced last year limits on the length of Swedish mortgage terms. They don’t bother with 50-year mortgages (On and On and On – Abba).

No, our Volvo-loving Swedish friend’s average mortgage length is 140 years (this is not a typo). Although such mortgages have had their Waterloo (Abba), regulators have significantly reduced the maximum term of a Swedish mortgage to 105 years. Either way, that’s a lot of Money, Money, Money (Abba again – Sorry!) to pay back!

Now I will leave you in peace as I listen to the 1980’s Madness song ‘Our House’. My apologies to all the Beatles and Abba fans in Greenwich – a bit of light hearted fun albeit on serious topic.

Greenwich Buy-To-Let Predictions up to 2037

1744

On several occasions over the last few months, in my Greenwich Property Blog, I predicted that the rate of rental inflation (i.e. how much rents are rising by) had eased over the last year. At the same time I felt that in some parts of the UK rents had actually dropped for the first time in over eight years. Recent research backs up this prediction.

Rents in Greenwich for new tenancies fell by 1.2% in the last 12 months (i.e. not existing tenants experiencing rental increases from their existing landlord). When we compare that current rate with the historical rental inflation in Greenwich, an interesting pattern emerges..

  • 2016 – Rental Inflation in Greenwich was 7.7%
  • 2015 – Rental Inflation in Greenwich was 9.2%
  • 2014 – Rental Inflation in Greenwich was 9.4%

The reason behind this change depends on which side of the demand/supply equation you are looking from. On the demand side (from the tenants point of view) there is the uncertainty of Brexit and the fact that salaries are not keeping up with inflation for the first time in three years. Critically this means tenants have less disposable income to pay their rent. As an aside, it is interesting to note that nationally, rent accounts for 29% of a tenant’s take home pay (Denton House).

On the supply side of the equation (landlords point of view) Brexit also creates uncertainty. However, the biggest issue was a massive upsurge of new rental properties coming on to the market in late 2016, caused by George Osborne’s new 3% stamp duty tax for landlords in the first part of 2016. This meant a lot of new rental properties were ‘dropped’ on to the rental market all at the same time. The greater choice of rental properties for tenants curtailed rental growth/inflation. A slight softening of Greenwich property prices has compounded this. Figures from The Bank of England suggested that first time buyers rose over the last 12 months as some were more inclined to buy instead of rent. Together, these factors played a part in the ongoing moderation of rental growth.

The lead up to the General Election in May didn’t help: after all people don’t like doubt and uncertainty. So now that we have a mandate for going forward over the next 5 years hopefully that has removed any stumbling blocks stopping tenants making the decision to move home.

Whether it be ‘hard’ or ‘soft’ Brexit negotiations (and with the Election result the Tory’s might have to be ‘softer’ on those negotiations) the simple fact is, we aren’t building enough properties for us to live in. Both in Greenwich, Greater London and the wider UK, long-term population trends imply that rents will soon be growing faster than inflation again. Look at the projections by the Office of National Statistics.

Population Estimates for Greenwich London Borough Council over the next 20 years

2016 (actual)

2021

2026

2031

2036

278,258

298,580

316,423

332,339

346,917

Tenants will still require a vibrant and growing rental sector to deliver them housing options in a timely manner. As the population grows in Greenwich, and wider afield, any restriction to the supply of rental properties (brought about by poor returns for landlords) cannot be in the long-term best interest of tenants. Simply put rents must go up!

The fact is that I see this as a short-term blip and rents will continue to grow in the coming years. With rents only accounting for 29% of a tenants’ disposable income, the ability for most tenants to absorb a rent increase does exist.