Greenwich Property Market – Which Houses are Actually Selling?

212 V1

Beast from the East, Russia, Facebook, Brexit, Trump, House prices up, House prices down … the Press is full of column inches on Brit’s favourite subjects of politics, scandal, weather and not forgetting (and I appreciate the irony of this!) the property market. As an agent belonging a national group of letting and estate agents, talking to my fellow property professionals from around the UK, the one thing that is immediately apparent is the UK does not have one property market. It is a hodgepodge patchwork (almost like a fly’s eye) of lots of small property markets all performing in different ways.

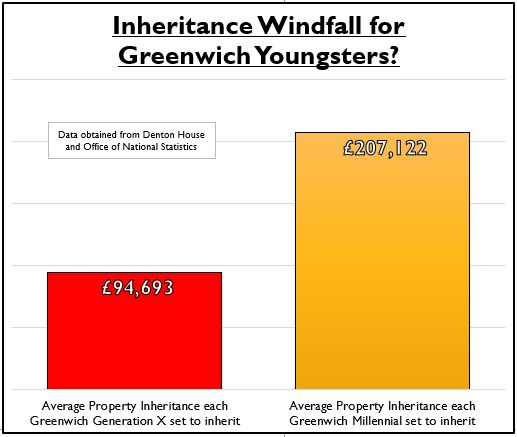
… And that made me think … is there just one Greenwich Property Market or many?

I like to keep an eye on the property market in Greenwich on a daily basis because it enables me to give the best advice and opinion on what (or not) to buy in Greenwich, be that a buy-to-let property for a Greenwich landlord or an owner occupier house for a home owner.  So, I thought, how could I scientifically split the Greenwich housing market into segments, so I could see which part of the market was performing the best and the worst.

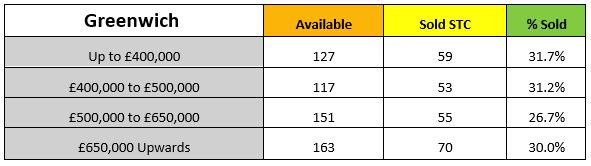
I decided the best way was to split the Greenwich property market into four equal size price bands (into terms of households for sale). Each price band would have around 25% of the property in Greenwich, from the lowest in value (the Lowest Quartile or 25%) all the way through to the highest 25% in terms of value, the Upper Quartile.  Looking at the market, I have calculated that these are the price bands in Greenwich are as follows:

  • Lowest Quartile (lowest 25% in terms of value) … Up to £400,000
  • Lower/Middle Quartile (25% to 50% Quartile in terms of value) … £400,000 to £500,000
  • Middle/Upper Quartile (50% to 75% Quartile in terms of value) … £500,000 to £650,000
  • Upper Quartile (highest 25% in terms of value) … £650,000 Upwards

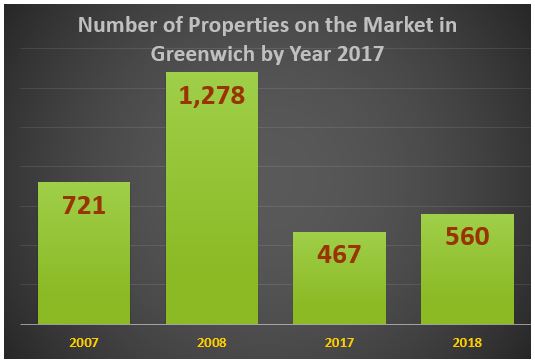
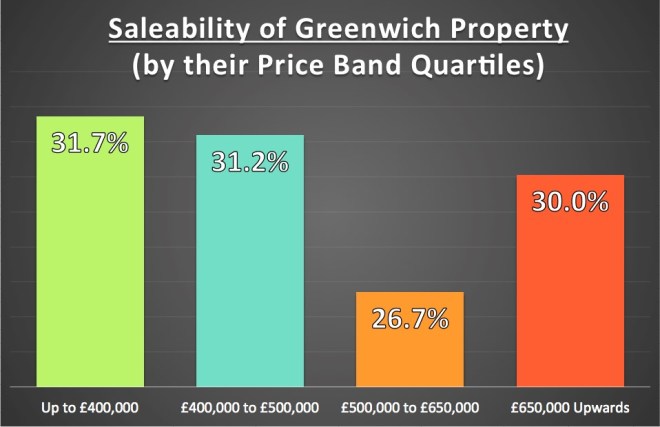
So, having split the Greenwich Property Market approximately into four equal sizes, the results in terms what price band has sold (subject to contract or stc) the most is quite enlightening –

Graph 212

Although the results are very close, the best performing price range in Greenwich is the lower market, although all sectors seem to be finding things a bit tough. Interestingly for Greenwich landlords, with the lower market not selling as well as expected, maybe there could be some bargains out there for buy to let investment? Even though the number of first time buyers did increase in 2017, it was from a low base and the vast majority of 20 something’s cannot buy, so need a roof over their head (hence the need to rent somewhere).

Bar graph 212

It is a fact that British (and Greenwich’s) housing markets have ridden the storms of Oil crisis in the 1970’s, the 1980’s depression, Black Monday in the 1990’s, and latterly the Credit Crunch together with the various house price crashes of 1973, 1987 and 2008. No matter what happens to us Brexit or anything else … unless the Government starts to build hundreds of thousands extra houses each year, demand will always outstrip supply … so maybe a time for Greenwich landlord investors to bag a bargain?

Want to know where those Greenwich buy to let bargains are?  Follow my Greenwich Property Blog or drop me an email because irrespective of which agent you use, myself or any of the other excellent agents in Greenwich, many local landlords ask me my thoughts, opinion and advice on what (and not) to buy locally … and I wouldn’t want you to miss out on those thoughts … would you?

20% More Greenwich Home Owners Wanting to Move Than 12 Months Ago

As I have mentioned a number times in my local property market blog, with not enough new-build properties being built in Greenwich and the surrounding area to keep up with demand for homes to live in (be that tenants or homebuyers), it’s good to know more Greenwich home sellers are putting their properties on to the market than a year ago.

At the start of 2007 there were 721 properties for sale in Greenwich but by July 2008, when the credit crunch was really beginning to bite, that number had risen to 1,278 properties on the market at a time when demand was at an all-time low, thus creating an imbalance in the local property market.

Basic economics dictates that if there is too much supply of something and demand is poor (which it was in the Credit Crunch years of 2008/9) … prices will drop. In fact, house prices dropped between 15% and 20% depending on the type of Greenwich property between the end of 2007 and Spring 2009.

However, over the last five years, we have seen a steady decrease in supply of properties coming onto the market for sale and steady demand, meaning Greenwich property prices have remained robust.  A stable housing market is one of the foundations of a successful British economy, as it’s all about getting the healthy balance of buyer demand with a good supply of properties. Nevertheless, if you had asked me a couple of years ago, I would have said we were beginning to see there was in fact NOT enough properties coming on to the market for sale … meaning in certain sectors of the Greenwich property market, house prices were overheating because of this lack of supply.

So, it is pleasing to note, looking at the recent numbers …

There are 20% more properties for sale in Greenwich today than a year ago

Graph 211

There were 467 properties for sale 12 months ago, and today that stands at 560. Definitely a step in the right direction to a more stable property market.

Even better news, since the Chancellor announced the stamp duty rule changes for first time buyers (FTB), my fellow agents in Greenwich say that the number of FTB’s registering on the majority of agent’s books has increased year on year. That has still to follow through into more FTB’s buying their first home, however, with the heightened levels of confidence being demonstrated by both Greenwich house sellers and potential house buyers, I do foresee the Greenwich Property Market will show steady yet sustained improvement during the first half of 2018.

What does this mean for Greenwich landlords or those considering dipping their toe into the buy to let market for the first time? Landlords will need to keep improving their properties to ensure they get the best tenants. It is true that demand amongst FTB’s is increasing, albeit from a low base. Even with the new landlord tax rules, buy to let in Greenwich still looks a good investment, providing Greenwich landlords with a good income at a time of low interest rates and a roller coaster stock market.

If you are thinking of investing in bricks and mortar in Greenwich, it is important to do things correctly as making money won’t be as easy as it has been over the last twenty years.  With a greater number of properties on the market .. comes greater choice. Don’t buy the first thing you see, buy with your head as well as your heart … and don’t forget the first rule of Buy To Let Investment …..

I will tell you that 1st rule in a couple of weeks!

Greenwich Property Market Worth More Than the Royal Bank of Scotland Group

The value of all the homes in Greenwich has risen by more than 327% in the past two decades, to £32.799bn, meaning its worth more than the stock listed company Royal Bank of Scotland Group, which is worth £32.192bn.

Those Greenwich homeowners and Buy-to-Let landlords who bought their homes twenty or more years ago have come out on top, adding thousands and thousands of pounds to the value of their own Greenwich homes as the younger generation in Greenwich continue to be priced out of the market.  This is even more remarkable because, in those twenty years, we had the years of 2008 and 2009 following the global financial crisis, where we saw a short term drop in Greenwich house prices of between 15% and 20% (depending on the type of property). And although there have been a number of consecutive years of growth in property values recently in Greenwich it hasn’t been anywhere near the levels seen in the early 2000’s.

Twenty years ago, the total value of Greenwich property was worth £7.665bn. Over those twenty years, total property values have increased by £25.134bn, meaning today, the total value of all the properties in Greenwich is worth £32.799bn. Even more remarkable, when you consider the FTSE100 has only risen by 40.84% in the same time frame. Also, when I compared it with inflation, i.e. the UK Retail Price Index, inflation had risen by 72.2% during the same twenty years.

So, what does this all mean for Greenwich?  Well as we enter the unchartered waters of 2018 and beyond, even though property values are already declining in certain parts of the previously over cooked central London property market, the outlook in Greenwich remains relatively good as over the last five years, the local property market has been a lot more sensible than central London’s.

Greenwich house values will remain resilient for several reasons. Firstly, demand for rental property remains strong with persistent immigration and population growth.  Secondly, with 0.25% interest rates, borrowing has never been so cheap and finally, the simple lack of new house building in Greenwich. Not even keeping up with current demand, let alone eating into years and years of under investment mean only one thing – yes it might be a bumpy ride over the next 12 to 24 months but, in the medium term, property ownership and property investment in Greenwich has and always will, out ride out the storm.

In the coming weeks, I will look in greater detail at my thoughts for the 2018 Greenwich Property Market. As always, all my articles can be found at the Greenwich Property Market Blog.

Greenwich Council Tax 17.99% Below Inflation Rise

Buying and selling a home in Greenwich isn’t the easiest or cheapest thing you will ever do. Estate Agent fees, Solicitors fees, Survey fees, Mortgage fees, Removal Van … the costs just mount up throughout every step of the move. Last week, a Greenwich landlord asked me whether the Council Tax Band made a difference to a property’s appeal, be it tenanted or to owner occupiers, when it comes to being sold on the open market and whether extensions or improvements made a difference to the tax banding?

Well, like I said, the first point you should always be aware of is what Council Tax Band your new house or apartment will fall under. Being aware of this before you buy/move will help when planning month by month for life in your home (or investment). But what exactly are Council Tax Bands, and how do they affect landlords/tenants/homebuyers?

How much Council Tax you pay depends on two variables. The first is which Council Tax Band your property is in. A property is placed into a specific band depending upon what the value of the property was in April 1991 – the date when the tax band system was applied. In a nutshell, what your property is worth today has no relevance whatsoever to your banding.

Council Tax Bands have a letter of the alphabet and range from bands A-H.

The Council Tax Band values are:

  • Band A – up to £40,000
  • Band B – £40,001 to £52,000
  • Band C – £52,001 to £68,000
  • Band D – £68,001 to  £88,000
  • Band E – £88,001 to £120,000
  • Band F – £120,001 to £160,000
  • Band G – £160,001 to £320,000
  • Band H – more than £320,000

So, for example, if a property sold for £110,000 in April 1991 but is now worth £350,000 it will remain in Band E – NOT Band H), as this was the value when the bands were set in 1991. For new homes, the same thing applies: they are valued based on the 1991 market value. This safeguards that all homes and all buyers are treated equally and consistently. The second factor that determines how much Council Tax you pay is what each individual local authority decides each band will pay in Council Tax. (So for example, a householder/tenant in Leeds in a Band E property will pay a different amount in Council Tax each year to someone in Swindon or North London in Band E).

Interestingly, the average current level of Council tax paid by Greenwich people stands at £950 per annum, up from £609 in 1993 (whereas if it had risen by inflation in those 25 years .. today that would be £1,158) … meaning Council Tax has increased by 17.99% less than inflation – bucking the national trend.

Graph 1

Contrary to what most people think, extensions and improvements do not change the Council Tax Band and existing householders/tenants only have to pay the same Council Tax as they would have without any extensions and improvements. However, the Valuation Office (The Government’s Property Valuers) do reserve the right to re-value the extended property if the property gets sold.  If you are a potential buyer, you should be aware of this review as it could change the amount of Council Tax you pay after the purchase. If a higher band is necessary, the new band will be based on what the extended property would have been expected to sell for in 1991. However, this does not necessarily mean that the banding will jump one band, as this is contingent on the extent of the changes and whether the property falls towards the top or bottom of its existing band. More often than not – it isn’t an issue and the banding stays the same.

In terms of which band the property is in, this can be challenged. In my experience in the Greenwich property market the only issue is one where there is an anomaly with the banding, when one property is in a different band to all the others in the street. This is much rarer than it used to be, as most such anomalies have been found and rectified. Anyone can check the banding of any property by going to Google and typing in “Check My Council Tax Banding”. I do need to mention a thoughtful warning though. Challenging your Council Tax Band is not something to do on a whim for one simple fact – you cannot request your band to be lowered, only ‘reassessed’, which means your band could be moved up as well as down. I have even heard of neighbouring properties band’s being increased by someone appealing, although this is the exception. If you have any questions don’t hesitate to drop me a line.

Homeownership Amongst Greenwich’s Young Adults Slumps to 35.45%

The degree to which young Greenwich people are locked out of the Greenwich housing market has been revealed in new statistics.

A Greenwich landlord was asking me the other week to what effect homeownership rates in Greenwich in the early to middle aged adult age range had affected the demand for rental property in Greenwich since the Millennium. I knew anecdotally that it affected the Greenwich rental market, but I wanted some cold hard numbers to back it up. As you know, I like a challenge when it comes to the stats.. so this is what I found out for the landlord, and I’d like to share them with you as well.

As anyone in Greenwich, and most would say those born more recently, are drastically less likely to own their own home at a given age than those born a decade earlier, let’s roll the clock back to the Millennium and compare the figures from then to today.

In the year 2000, 35.9% of Greenwich 28-year olds (born in 1972) owned their own home, whilst a 28 year old today born in 1990) would have a 19.2% chance of owning their own home. Next, let’s look at someone born ten years before that. So, going back to the Millennium, a 38 year Greenwich person (therefore born in 1962) would have a 53.0% chance of owning his or her own home and a 38 year today in Greenwich (born in 1980) would only have a 41.3% chance of owning their own home.

Since the Millennium, overall general homeownership in the 25 to 44 year old age range in Greenwich has reduced from 40.02% to 35.45%

If you look at the graph below, split into the four age ranges of 25 year olds (yo) to 29yo, 30yo to 34yo, 35yo to 39yo and finally 40yo to 44 yo, you will quite clearly see the changes since the Millennium in Greenwich. The fact is the figures in Greenwich show the homeownership rate has proportionally fallen the most for the youngest (25yo to 29yo) age range compared to the other age ranges.

Graph208

The landlord suggested this deterioration in homeownership in Greenwich across the age groups could be down to the fact that more of those born in the 1980’s and 1990’s (over those born in the 60’s and 70’) are going to University and hence entering the job market at an older age or those young adults are living with their parents longer.

I read some national homeownership statistics of different age groups with the same number of years after they left education (rather than at the same age) and that gave an identical dip to the graph above.  Neither are these drops in homeownership related with a significant increase in the number of young adults living with their parents. Again, nationally, that has hardly changed over the last 20 years as the percentage of 30-year-olds living with Mum and Dad only increased from 22% of those born in the early ‘70s to 23% of those born in the early ‘80s.

So, what does this mean for the rental market in Greenwich?

Only one thing .. with the local authority not building Council houses, Housing Associations strapped for cash to build new properties and the younger generation not buying, there is only one way these youngsters can obtain a roof over their head and have a home of their own .. through the private landlord sector. Now with the new tax rules and up and coming licensing rules, Greenwich landlords will have to work smarter to ensure they make the investment returns they have in the past. If you ever want to pick my brains on the future direction of the Greenwich rental market .. drop me line or pop in next time you are passing my office.

184 First Timer Buyers in Greenwich Bought Their First Home in 2017

A little bit of good news this week on the Greenwich Property Market as recently released data shows that the number of first time buyers taking out their first mortgage in 2017 increased more than in any other year since the global financial crisis in 2009. The data shows there were 184 first time buyers in Greenwich, the largest number since 2006.

I expect in 2018 that this increase of first time buyers will level out and maybe dip slightly as, nationally, figures demonstrate that first time buyer’s average household income was £40,691 and this represented 17.3% of their take home pay. Although, it might surprise readers that it is actually cheaper to buy than it is to rent at the ‘starter home’ end of the housing market. Many of you can remember mortgage rates at 12% … even 15%. Today, at the time of writing this article, I found on the open market, 189 first time buyer mortgages at 95% (meaning only a 5% deposit was required) with 3 year fixed rates from a reputable High Street bank at 2.49% … they even did a 3 year fixed rate 100% mortgage for 2.89%!

Interestingly, looking at the other end of the market, the buy-to-let investment in Greenwich was subdued, with only 38 buy-to-let properties being purchased with a mortgage. However, I must stress, whilst there is no hard and fast data on the total numbers of landlords buying buy-to-let, as HM Treasury believes only 30% to 40% of buy-to-let property is bought with a mortgage. This means there would have been further cash only buy-to-let purchases in Greenwich – it’s just that the data isn’t available at such a granular level.

In terms of the level of mortgage debt in Greenwich, looking specifically at the SE10 postcode, as you can see there has been a steady rise in borrowing over the last few years.

graph 207

This is pleasing to see, as new mortgage debt is created by first time buyers, buy-to-let landlords and home movers themselves, that is being roughly equalled by the amount being paid off with mature mortgaged homeowners in their 50’s and 60’s finally paying off their mortgage.

So, what does all this mean for the Greenwich Property Market?  Well, the stats paint a picture, but they don’t inform us of the whole story. The upper end of the Greenwich property market has been weighed down by the indecision around the Brexit negotiations and rise in stamp duty in 2014, when made it considerably more expensive to buy a home costing more than £1m. The middle part of the Greenwich property market has been affected by issues of mortgage affordability and lack of good properties to buy, as selling prices have reached the limit of what buyers can afford under existing mortgage regulations. The lower to middle Greenwich property market was hit by tax changes for buy-to-let landlords, although this has been offset by the increase in first time buyers.

If you are in the market and selling now and want to ensure you get your Greenwich property sold, the bottom line is you have to be 100% realistic with your pricing from day one and you might not get as much as you did say a year ago (but the one you want to buy will be less – swings and roundabouts?). I know it’s not comfortable hearing that your Greenwich home isn’t worth as much as you thought, but Greenwich buyers are now unbelievably discerning.

So, if you are thinking of selling your Greenwich property in the coming months, don’t ask the agent out a few days before you want to put the property on the market, get them out now and ask them what you need to do to ensure you get maximum value in the shortest possible time. I, like most Greenwich agents, will freely give that advice to you at no cost or commitment to you.

An extension could add £110,050 to the value of your Greenwich home

206 graphic

As our families grow bigger the need for more space, be that bedrooms or reception rooms, has grown with it. Also, as our older generation lives longer and nursing home bills continue to rise quicker than a rocket on the 5th of November  (the average nursing home bill in the area being £862.50 per week) many families are bringing two households into one larger one.

So, should you move somewhere larger, or extend your Greenwich property to make it large enough for you and your family? In some circumstances the choice has been made for you. If you live in an apartment with no garden, there isn’t much of an opportunity of making it larger. But if you have a house with a garden or an attic with sufficient headroom, extending your home becomes a real prospect.

Even if it makes more sense to extend or move, the choice hangs on a number of different dynamics – your future plans, money (both saved and access to finance), in what way you are emotionally attached to your home, the particular area of Greenwich you live in and finally, the type/style of house you prefer.

Interestingly, the average British home is 968 sq.ft, which as you can see from the table, is in the middle of developed nations when it comes to the size of a property. Of the 1.11m homes sold in 2016 in England and Wales, the average floor area of the houses was 1,119 sq.ft – that’s about an eighth the size of an Olympic sized swimming pool. Apartments averaged 530 sq.ft that’s just over ten times bigger than an average garden shed. Looking at apartments and houses together, the average size of properties sold in England and Wales 968 sq.ft  – are slightly smaller than the European average, and much smaller than households in the US.

206 Graph

So back to the question in hand.. extending does mean you will have a lot of inconvenience whilst the work is being carried out. The location of your Greenwich property, the quality of construction, what type of room(s) you want to add, your plot, neighbouring building lines, planning regulations and the overall demand for your type of Greenwich home, will make a vast difference to the financial repercussions of extending versus moving.

A medium-sized 270 sq.ft single storey extension (say around 17ft x 16ft) will add on average £110,050 to the value of a property in Greenwich

It’s important to note the end result of the extension needs to be a sensible and realistic home. A two bed semi-detached house extended to a four bedrooms with no lawn or driveway, or a home with outsized reception rooms downstairs and miniscule bedrooms upstairs, could be problematic if  and when you come to sell your home in the future. Irrespective of whether your strategy is to live in your extended home for a long time, you will want to side-step outlaying a lot of money on costly building work that will make it tougher to sell.

In terms of what it would cost to build an extension, you can expect to pay on average between £140 to £200 per sq.ft, depending whether the extension is a single or double storey extension and other factors including finish and type of extension (note – I have seen it cost a lot more than these figures – so please speak with a builder) … So taking a mid line figure, that same 270 sq.ft extension on your Greenwich home would cost on average £55,080.

However, moving means there are substantial costs incurred – Estate Agency fees, Removal Van, Survey Fees, Legal fees and Stamp Duty on the property you are buying. Neither option is the obvious choice and comparing the costs of extending your Greenwich home to that of moving is not a stress-free undertaking.

How realistic each option is will probably come down to one thing .. your mortgage provider. You will need a considerable sum of equity in your Greenwich home before you can think of increasing your mortgage more, because most lenders will require you to have at least 10% to 20% equity left in your property after the extension or move has been done.

The best advice I can give .. don’t assume anything …. get advice and opinion from builders, mortgage brokers, architects, mortgage people and of course… an agent. Look at your options and make an educated decision with all the superficial and objective facts in front of you.

Greenwich Property Market – The 9.5% ‘New Build Premium’

According to the National House Building Council (NHBC), more than 17,800 new homes were registered to be built in London last year, an increase of 1.5% on 2016 levels of 17,500 dwellings. Great news when you consider it is one of the highest number of new builds in the region since the pre-recession levels of the Credit Crunch and the uncertainty of Brexit and the General Election.

So, when a landlord recently asked me why the brand-new property she was considering buying was a lot more expensive compared to a second-hand/existing property of similar type, accommodation, location and structure I thought this would make a fascinating topic to do some homework on … homework I want to share with the homeowners and landlords of Greenwich.

You might believe that the difference between purchasing a new build home against purchasing a second-hand/existing home is just individual preference. Some buyers/tenants like the ostentatious trendy modern feel of a new home, whilst others like a home that has stood the test of time.

So, what is the right answer? Well, I am going to be looking at some statistics that shows there is a real difference in the Greenwich London Borough Council area’s property market when in to comes to new vs existing homes and the price paid. Looking at the average price paid for existing (second-hand) versus a brand new home since 1996, one can see from the graph it makes interesting reading.

graph 1

graph 2

Yet possibly nothing is ever that easy, as there are issues with these statistics.

Whilst, the overall average for the whole Greenwich London Borough Council area for the ‘new build premium’ (new build premium being the additional price a buyer pays for buying a new property compared to a second-hand one) over the last 21 years has been 9.5%. These statistics actually show that it is problematic to compare like with like because it is impossible to completely separate all the different factors of type, accommodation, location and structure etc.

One would have to have a mirror image second-hand Greenwich home and a duplicate new build right next door to each other, then calculate out which Greenwich house buyers or Greenwich buy to let landlords would pay more for? Perhaps if everything was the same (all things being equal), there might not be any difference in what buyers would be prepared to pay… but then again, it’s like new cars versus cars that have a few hundred miles on the clock … there is always a difference on the forecourt … because things are never wholly equal.

What I do know is that my statistics of the Greenwich property market show that new build Greenwich apartments are worth more to people than their second-hand equivalents, whilst the difference is negligible between new build Greenwich detached houses and second-hand Greenwich detached houses.

However, I believe the really important lesson in all these statistics is the fact that ‘new build premium’ for new-build versus buying a second-hand property increases in a buoyant market and reduces in a tougher market.  So, if you want to buy new and the only consideration is money … try buying in a tougher challenging property market.

Greenwich’s ‘Millennials’ set to inherit £207,122 each in property!

204 facebook size

That got your attention … didn’t it!

But before we start, what is Generation X, let alone Generation Z, Millennials, Baby Boomers  … these are phrases banded around about the different life stages (or subcomponents) of our society. But when terminologies like this are used as often and habitually as these phrases (i.e. Gen X this, Millennial that etc.), it appears particularly vital we have some practical idea of what these terms actually mean. The fact is that everyone uses these phrases, but often, like myself, they are not exactly sure where the lines are drawn …until now…

So, for clarity …

Generation Z:              Born after 1996

Millennials:                 Born 1977 to 1995

Generation X:              Born 1965 to 1976

Baby Boomers:            Born 1946 to 1964

Silent Generation:       Born 1945 and before

My research shows there are 798 households in Greenwich owned by Greenwich Baby Boomers (born 1946 to 1964) and Greenwich’s Silent Generation (born 1945 and before). It also shows there are 7,565 Generation X’s of Greenwich (Greenwich people born between 1965 to 1976). Looking at demographics, homeownership statistics and current life expectancy, around two-thirds of those Greenwich 7,565 Generation X’s have parents and grandparents who own those 798 Greenwich properties.

… and they will profit from one of the biggest inheritance explosions of any post-war generation to the tune of £478m of Greenwich property or £94,693 each but they will have to wait until their early 60’s to get it!

However, it’s the Millennials that are in line for an even bigger inheritance windfall.

There are 6,274 Millennials in Greenwich and my research shows around two thirds of them are set to inherit the 6,158 Greenwich Generation X’s properties. Those Generation X’s Greenwich homes are worth £785m meaning, on average, each Millennial will inherit £207,122; but not until at least 2040 to 2060!

Graph 1

While the Greenwich Millennials have done far less well in amassing their own savings and assets, they are more likely to take advantage of an inheritance boom in the years to come. This will probably be very welcome news for those Greenwich Millennials, including some from poorer upbringings who in the past would have been unlikely to receive gifts and legacies.

However, inheritance is not the magic weapon that will get the Millennials on to the Greenwich housing ladder or tackle growing wealth cracks in UK society, as the inheritance is unlikely to be made available when they are trying to buy their first home…but before all you Greenwich Millennials start running up debts, over 50% of females and around 35% of men are going to have to pay for nursing home care. Interestingly, I read recently that a quarter of people who have to pay for their care, run out of money.

So, if you are a Greenwich Millennial there potentially will be nothing left for you.

Of course, most parents want to give their children an inheritance, the consideration that what you have worked genuinely hard for over your working life won’t go to your children to help them through their lives is a really awful one … maybe that is why I am seeing a lot of Greenwich grandparents doing something meaningful, and helping their grandchildren, the Millennials, with the deposit for their first house.

One solution to the housing crisis in Greenwich (and the UK as a whole) is if grandparents, where they are able to, help financially with the deposit for a house. Buying is cheaper than renting – we have proved it many times in these articles … so, it’s not a case of not affording the mortgage, the issue is raising the 5% to 10% mortgage deposit for these Millennials.

Maybe families should be distributing a part of the family wealth now (in the form of helping with house deposits) as opposed to waiting to the end… it will make so much more of a difference to everyone in the long run.

Just a thought?


Greenwich’s £545,365,440 “Rentirement” Property Market Time Bomb

203 linkedin or twitter shaped image

Yes, I said ‘rentirement’, not retirement … rentirement and it relates to the 1,343 (and growing) Greenwich people, who don’t own their own Greenwich home but rent their home, privately from a buy to let landlord and who are currently in their 50’s and early to mid-60’s.

The truth is that these Greenwich people are prospectively soon to retire with little more than their state pension of £155.95 per week, probably with a small private pension of a couple of hundred pounds a month, meaning the average Greenwich retiree can expect to retire on about £200 a week once they retire at 67.

The average rent in Greenwich is £1,692 a month, so a lot of the retirement “income” will be taken up in rent, meaning the remainder will have to be paid for out their savings or the taxpayer will have to stump up the bill (and with life expectancy currently in the mid to late 80’s, that is quite a big bill …  a total of £545,365,440 over the next 20 years to be paid from the tenant’s savings or the taxpayers coffers to be precise!

You might say it’s not fair for Greenwich tax payers to pick up the bill and that these mature Greenwich renters should start saving thousands of pounds a year now to be able to afford their rent in retirement.  However, in many circumstances, the reason these people are privately renting in the first place is that they were never able to find the money for a mortgage deposit on their home in the first place, or didn’t earn enough to qualify for a mortgage …and now as they approach retirement with hope of a nice council bungalow, that hope is diminishing because of the council house sell off in the 1980’s!

For a change, the Greenwich 30 to 40 somethings will be better off, as their parents are more likely to be homeowners and cascade their equity down the line when their parents pass away.  For example, that is what is happening in Europe where renting is common, the majority of people rent in their 20’s, 30’s and 40’s, but by the time they hit 50’s and 60’s (and retirement), they will invest the money they have inherited from their parents passing away and buy their own home.

So, what does this all mean for buy to let landlords in Greenwich?

Have you noticed how the new homes builders don’t build bungalows anymore … in fact some would said the ‘bungalow storey’ is over.  The waning in the number of bungalows being built has more to do with supply than demand.  The fact is that for new homes builders there is more money in constructing houses than there is in constructing bungalows.  Bungalows are voracious when it comes to land they need as because bungalow has a larger footprint for the same amount of square meterage as a two/three storey house due to the fact they are on one level instead of two or three.

That means, as demand will continue to rise for bungalows supply will remain the same.  We all know what happens when demand outs strips supply … prices (i.e. rents) for bungalows will inevitably go up.