The Greenwich House Price Index: 186.33

I had the most interesting conversation the other day with a local Greenwich accountant, who asked me about my articles on the Greenwich property market. It was quite humbling to be given praise by such a professional, when he commented enthusiastically on the articles I write. He was particularly interested with the graphs, facts and figures contained within them – so much so he recommended his clients read them, as most of them were either Greenwich homeowners, Greenwich landlords and a lot of the time – both. However, one question that kept me on my toes was, “With so many House-Price-Indices, how do you know which one to use and how can you calculate what is exactly happening in Greenwich?

To start with, there are indeed a great number of these Indices, including the Land Registry, Office of National Stats, Halifax, Nationwide and LSL to name but a few. The issue occurs when these different house price indices give diverse pictures of the state of the UK housing market. Whilst some indices measure the average value of every property in the UK (sold or unsold), others measure the average ‘price-paid’ of houses that happen to be sold over a fixed time scale… confusing isn’t it!

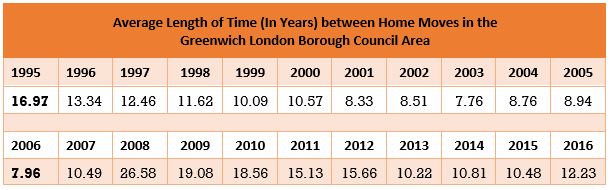
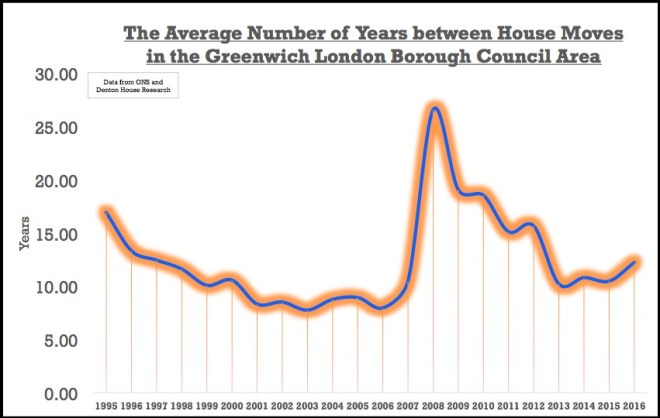
A lot of the variance between house price indices occurs because of the distinctive ways in which the numerous indices endeavour to beat these issues. You see, the biggest problem in creating a house-price-index when comparing and contrasting with most other indexes (e.g. inflation where the price a ubiquitous tin of Beans can easily be measured over the months and years), is every home is unique and as Greenwich people are only moving every 12 years, it appears the only thing that can be measured is the price of property sold in a given month.

By their very nature, all of the indices are only able to paint a picture of the whole of the UK or, at best, the regional housing market. As I have said many times in my articles on the Greenwich property market, it is important to look to the medium term when considering house price inflation/deflation. Looking at the month-to-month jumps, many indices look like one of those jumpy lie-detector needles you see in the cold war movies!

I can guarantee you in the coming few months, on a month-by-month basis, one or more of the indices will say property prices will have dropped. Let me tell you, no property market indices are representative of the housing market in the short term. Many indices have shown a drop around the Christmas and New Year months, even the boom years of 2001 to 2007 and 2013 to 2015.

So, back to the question, how do we work out what is happening in the Greenwich Property Market and can there be a Greenwich House Price Index?

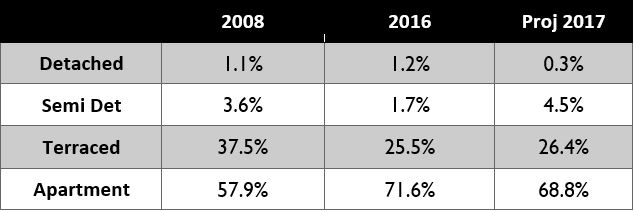
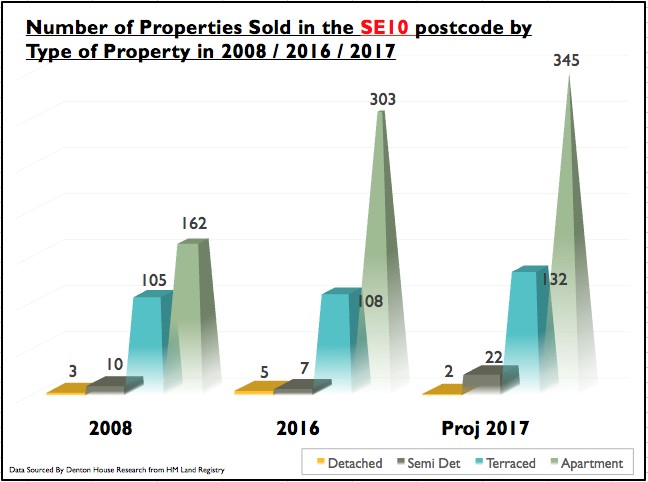
To calculate what I consider is a fair and proper House Price Index for Greenwich, I initially needed to decide on a starting place for the index. I have chosen 2008 as far enough away, but still gives us a medium/long term view. Next, I split all the house sales into their types (Detached/Semi/House /Apartment) to give us an indication of what is actually selling by postcode district. So, for example, below is a table for the SE10 postcode district (the sample shows 2008, 2016 and 2017.

Capture

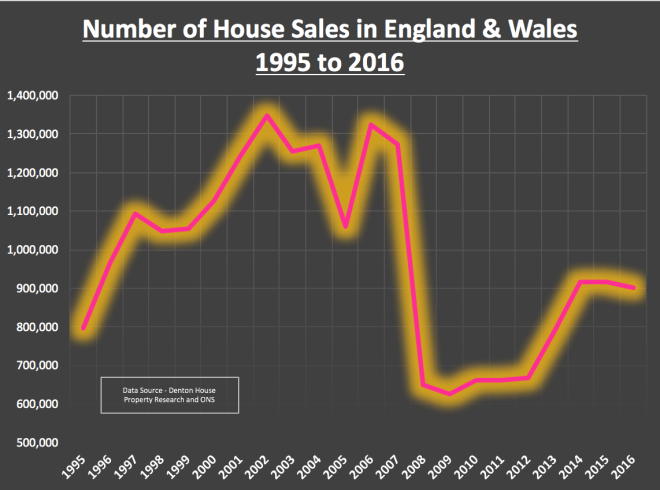
Then I look at the actual numbers of properties sold in the SE10 postcode district. Below is the graph with the numbers for the years already mentioned.

Graph 1

Next, I have looked at the prices paid for those types for every year since 2008, again in this example using the sample years of 2008, 2016 and 2017 for the SE10 postcode.

Graph 2

Finally, I amalgamated the same data points for the other postcode districts covered by Greenwich and the surrounding villages, weighted it accordingly, to produce the Greenwich House Price Index … which after all that work, currently stands at for Q4 2017 at 186.33 (Q4 2008 = 100).

I hope you found that of interest and over the coming months and seasons, I shall refer back to Greenwich House Price Index in my Greenwich Property Blog to give you a flavour of what is really happening in the Greenwich Property Market.

482 rental properties in the Greenwich area will be illegal in 2018

192 v1

As the winter months draw in and the temperature starts to drop, keeping one’s home warm is vital. Yet, with the price of gas and electricity rising quicker than a Saturn V rocket and gas, oil and electricity taking on average 4.4% of a typical Brit’s pay packet (and for those Brit’s with the lowest 10% of incomes, that rockets to an eye watering 9.7%), whether you are a tenant or homeowner, keeping your energy costs as low as possible is vital for the household budget and the environment as a whole.

For the last 10 years, every private rental property must have an Energy-Performance-Certificate (EPC) rating.  The property is given an energy rating, very similar to those on washing machines and fridges with the rainbow coloured graph, of between A to G (A being the most efficient and G the worst). New legislation comes in to force next spring (2018) for English and Welsh private landlords making it illegal to let a property that does not meet a certain energy rating. After the 1st of April next year, any new tenant moving into a private rented property or an existing tenant renewing their tenancy must have property with an energy performance rating of E or above on the property’s EPC and the new law will apply for all prevailing tenancies in the spring of 2020. After April 2018, if a landlord lets a property in the ‘F’ and ‘G’ ratings (i.e. those properties with the worst energy ratings) Trading Standards could fine the landlord up to £4,000.

Personally, I have grave apprehensions that many Greenwich landlords may be totally unaware that their Greenwich rental properties could fall below these new legal minimum requirements for energy efficiency benchmarks. Whilst some households may require substantial works to get their Greenwich property from an F/G rating to an E rating or above, my experience is most properties may only need some minor work to lift them from illegal to legal. By planning and acting now, it will mitigate the need to find tradespeople in the spring when every other Greenwich landlord will be panicking and paying top dollar for work to comply.

Whilst there is money and effort involved in upgrading the energy efficiency of rental property, a property that is energy efficient will have greater appeal to tenants and other buy-to-let landlords/investors and this will enable you to obtain higher rents and sale price (when you come to sell your investment).

Graph 1

So, how many properties are there in the area that are F and G rated .. well quite a few in fact. Looking at the whole of the Greenwich London Borough Council area, of the 20,004 privately rented properties, there are ..

  • 360 rental properties in the F banding
  • 122 rental properties in the G banding

That means just over one in 41 rental properties in the Greenwich and surrounding area has an Energy Performance Certificate (EPC) rating of F or G. From April next year it will be illegal to rent out those homes rated F and G homes with a new tenancy.

Talking with the Energy Assessors that carry out our EPC’s, they tell me most of a building’s heat is lost through draughty windows/doors or poor insulation in the roof and walls. So why not look at your EPC and see what the assessor suggested to improve the efficiency of your property? I can find the EPC of every rental property in Greenwich, so irrespective of whether you are a client of mine or not, don’t hesitate to contact me via email (or phone) if you need some guidance on finding out the EPC rating or need a trustworthy contractor that can help you out?

Greenwich Homeowners Are Only Moving Every 12 Years (Part 2)

190 v2

In the credit crunch of 2008/9 the rate of home moving plunged to its lowest level ever. In 2009 the rate at which a typical house would change hands slumped to only once every 19 years. The biggest reason being that confidence was low and many homeowners didn’t want to sell their home as Greenwich property prices plunged after the onset of the financial crisis in 2008. However, since 2009, the rate of home moving has increased (see the table and graph below), meaning today:

The average period of time between home moves in Greenwich is now 12 years.

This is an increase of 56.00 per cent between the credit crunch fallout year of 2009 and today, but still it is a 30.44 per cent drop in moves by homeowners, compared to 15 years ago (The Noughties).

Capture 1

Graph 1

So why aren’t Greenwich homeowners moving as much as they did in the Noughties?

The causes of the current state of play are numerous. In last weeks article I talked about how ‘real’ incomes and savings had been dropping. Another issue is the long-term failure in the number of properties being built. Only a few weeks ago in the blog, I was discussing the draconian planning rules meaning house builders struggle to locate building land to actually build on.

Back in the 1960’s and 1970’s, as a country, we were building on average 300,000 and 350,000 households a year. The Barker Review a few years ago said that for the UK to stand still and keep up with housing demand (through immigration, people living longer, a just under 50% increase in the number of households with a single person since the 1980’s and family makeup (i.e. divorce makes one household now two)) we needed to build 240,000 households a year. Over the last few years, we have only been building between 135,000 and 150,000 households a year.

Finally, as the UK Population gets older, there is no getting away from the fact that a maturing population is a less mobile one.

So, what does this mean for Greenwich homeowners and landlords?

Well, if Greenwich people are less inclined to move or find it hard to sell a property or acquire a new one, they are probably less likely to move to an improved job or a more prosperous part of the UK.

Many of the older generation in Greenwich are stuck in property that is simply too big for their needs. The fact is that, in the Greenwich Borough, more than three out of every ten (or 34.4 per cent) owned houses has two or more spare bedrooms; or to be more exact …

15,563 of the 45,299 owned households in the Greenwich area have two or more spare bedrooms.

So, as their children and grandchildren struggle to move up the housing ladder, with those young families bursting at the seams in homes too small for them i.e. overcrowding, we have a severe case of under-occupation with the older generation – grandparents staying put in their bigger homes, with a profusion of spare bedrooms.

Regrettably, I cannot see how the rate of properties being sold will rise any time soon. Many commentators have suggested the Government should give tax breaks to allow the older generation to downsize, yet in a recent White Paper on housing published just weeks before the General Election, there was no reference of any thoughtful and detailed policies to inspire or support them to do so.

This means that there could be an opportunity for Greenwich buy to let landlords to secure larger properties to rent out, as the demand for them will surely grow over the coming years. As for homeowners; well those in the lower and middle Greenwich market will find it a balanced sellers/buyers market, but will find it slightly more a buyers market in the upper price bands.

Interesting times ahead!

Greenwich Home Owners Are Only Moving Every 12 Years (Part 1)

189 and 190 v2
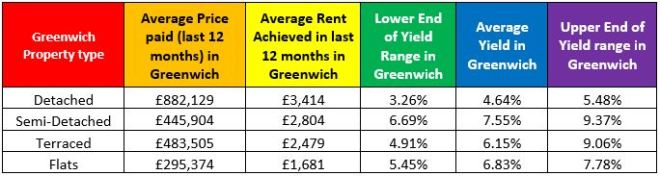
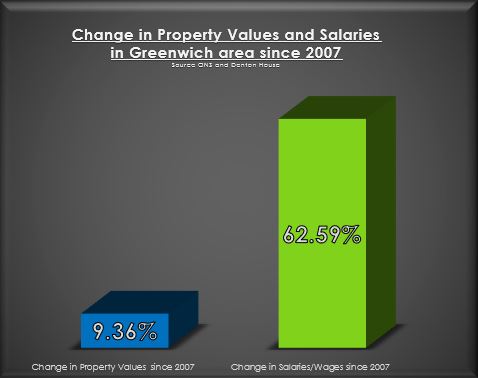
As I mentioned in a previous article, the average house price in Greenwich is 12.4 times the average annual Greenwich salary. This is higher than the last peak of 2008, when the ratio was 8.21. A number of City commentators anticipated that in the ambiguity that trailed the Brexit vote, UK (and hence Greenwich) property prices might drop like a stone. The point is – they haven’t.

Now it’s true the market for Greenwich’s swankiest and poshest properties looks a little fragile (although they are selling if they are realistically priced) and overall, Greenwich property price growth has slowed, but the lower to middle Greenwich property market appears to be quite strong.

Scratch under the surface though, and a different long-term picture is emerging away from what is happening to property prices. Greenwich people are moving home less often than they once did. Data from the Office of National Statistics shows that the number of properties sold in 2016 is again much lower than it was in the Noughties. My statistics show…

img 1

GRaph 1

Even though we are not anywhere near the post credit crunch (2008 and 2009) low levels of property sales, the torpor of the Greenwich housing market following the 2016 Brexit vote has seen the number of property sales in Greenwich and the surrounding local authority area level off to what appears to be the start of a new long term trend (compared the Noughties).

Interestingly, it was the 1980’s that saw the highest levels of people moving home. Nationally, everyone was moving on average every decade. Even though it was during the Labour administration of the late 1970’s where the right to buy one’s council house started, it was the Housing Act of 1980 that that really got council tenants moving, as Thatcher’s Tory government financially encouraged council tenants to buy their council-rented homes – for which countless then sold them on for a profit and moved elsewhere. The housing market was awash with money as banks were allowed to offer mortgages as well as the existing building societies, meaning it made it simpler for Brits to borrow even more money on mortgages and to climb up the housing ladder.

But coming back to today, looking at the property sales figures in the Greenwich area since 2010/11, a new trend of number of property sales appears to have started. Interestingly, this has been mirrored nationally. The reasons behind this are complex, but a good place to start is the growth rate of real UK household disposable income, which has fallen from 5.01% a year in 2000 to 1.68% in 2016. Also, things have deteriorated since the country voted to leave the EU as consumer price inflation has risen to 2.7% per Annum, meaning inflation has eaten away at the real value of wages (as they have only grown by 1.1% in the same time frame).

With meagre real income growth, it has become more difficult for homeowners to accumulate the savings needed to climb up the housing ladder as the level of saving has also dropped from 4.26% of household income to -1.11% (i.e. people are eating into their savings).

Next week I will be discussing how these (and other issues) has meant the level of Greenwich people moving home has slumped to once every 12 years.

Greenwich House Prices Outstrip Wage Growth by 52.59% since 2007

188 v2

I recently read a report by the Yorkshire Building Society that 54% of the country has seen wages (salaries) rise faster than property prices in the last 10 years. The report said that in the Midlands and North, salaries had outperformed property prices since 2007, whilst in other parts of the UK, especially in the South, the opposite has happened and property prices have outperformed salaries quite noticeably.

As regular readers of my blog know, I always like to find out what has actually happened locally in Greenwich. To talk of North and South is not specific enough for me. Therefore, to start, I looked at what has happened to salaries locally since 2007. Looking at the Office of National Statistics (ONS) data for Greenwich London Borough Council, some interesting figures came out…

Capture 1

Graph 1

Salaries in Greenwich have risen by 9.36% since 2007 (although it’s been a bit of a rollercoaster ride to get there!) – interesting when you compare that with what has happened to salaries regionally (an increase of 13.76%) and nationally, an increase of 17.61%.

Next, I needed to find what had happened to property prices locally over the same time frame of 2007 and today. Net property values in Greenwich are 62.59% higher than they were in late 2007 (not forgetting they did dip in 2008 and 2009). Therefore…

Property values in the Greenwich area have increased at a higher rate than wages to the tune of 53.23% … meaning, Greenwich is in line with the regional trend

Graph 2

All this is important, as the relationship between salaries and property values is the basis on how affordable property is to first (and second, third etc.) time buyers. It is also vitally relevant for Greenwich landlords as they need to be aware of this when making their buy-to-let plans for the future. If more Greenwich people are buying, then demand for Greenwich rental properties will drop (and vice versa).

As I have discussed in a few articles in my blog recently, this issue of ‘property-affordability’ is a great bellwether to the future direction of the Greenwich property market. Now of course, it isn’t as simple as comparing salaries and property prices, as that measurement disregards issues such as low mortgage rates and the diminishing proportion of disposable income that is spent on mortgage repayments.

On the face of it, the change between 2007 and 2017 in terms of the ‘property-affordability’ hasn’t been that great. However, look back another 10 years to 1997, and that tells a completely different story. Nationally, the affordability of property more than halved between 1997 and today. In 1997, house prices were on average 3.5 times workers’ annual wages, whereas in 2016 workers could typically expect to spend around 7.7 times annual wages on purchasing a home.

The issue of a lack of home ownership has its roots in the 1980’s and 1990’s. It’s quite hard as a tenant to pay your rent and save money for a deposit simultaneously, meaning for many Greenwich people, home ownership isn’t a realistic goal. Earlier in the year, the Tories released proposals to combat the country’s ‘broken’ housing market, setting out plans to make renting more affordable, while increasing the security of rental deals and threatening to bring tougher legal action to cases involving bad landlords.

This is all great news for Greenwich tenants and decent law-abiding Greenwich landlords (and indirectly owner occupier homeowners). Whatever has happened to salaries or property prices in Greenwich in the last 10 (or 20) years … the demand for decent high-quality rental property keeps growing. If you want a chat about where the Greenwich property market is going – please read my other blog posts on greenwichpropertyblog.co.uk or drop me note via email, like many Greenwich landlords are doing.

Moving from a 2 bed Greenwich Property to a 4 bed will cost you £2,655 pm

187 v2

Moving to a bigger home is something Greenwich people with growing young families aspire to. Many people in two bedroom homes move to a three-bedroom home and some even make the jump to a four-bed home. Bigger homes, especially three-bed Greenwich homes are much in demand and it can be a costly move.

If you live in Greenwich in a two-bedroom property and wish to move to a four-bedroom house in Greenwich, you would need to spend an additional £672,184 (or £2,655.13 pm in mortgage payments (based on the UK Bank average standard variable rate)). However, going straight to a four bed from a two-bed home is quite rare as most people jump from a two to three-bedroom home, then later in life, from a three to four-bedroom home.

So, after being asked my thoughts on moving home in Greenwich by a friend recently, please find my analysis of the local property market and then some thoughts. To start with, let us see what the average property price is for a Greenwich property by the number of bedrooms it has.

Capture 1

Table 1

I then decided to calculate what it would cost to make the jump upmarket from one bedroom to two bedrooms, two to three bedrooms etc, etc, both in actual money and in mortgage payments (using the current standard variable rate of UK Banks of 4.74% – so the mortgage cost could be higher or lower depending on the mortgage taken).

Capture 2

There are some interesting jumps in costs when moving upmarket as a Greenwich buyer. The cost of moving from one to two beds, and two to three beds is relatively reasonable, whilst the jump from three to four beds in Greenwich is quite high (and hence why some four bed properties are taking slightly longer to sell nowadays). On an aside, a lesson here for all my landlord property blog readers, you can quite clearly see why the larger 4 and 5 bed properties don’t offer the best returns for buy to let because the monthly finance costs and rents achieved don’t match up so well (i.e. A mortgage for a 4 bed home in Greenwich would cost you 54.58% compared to a 3 bed mortgage, but the jump in rent would be a lot less than that – although depending on your circumstances, 4 bed homes can offer other advantages to buy to let – pick up the phone if you want to know what they are in more detail).

So, coming back and looking at the stock of properties in Greenwich, this also makes interesting reading …

Capture 3

Table 2

The most active purchasers are 20 something and 30 something home-owning parents with growing families. Many look to more modern developments for the perfect balance of access to decent primary schools, commutability and lifestyle. For landlords looking to buy within Greenwich, they face stiff competition from these 20/30 something families, making the three bedroom Greenwich home massively in demand, often attracting spirited offers and selling within weeks of listing. This mix of home buyers and landlords is a pressure point in the Greenwich property market.  Again, if you are a landlord, call me and I will show you areas with decent returns where you aren’t in so much competition with young Greenwich family home buyers.

Yet, the cost of an additional bedroom can be too much for some Greenwich buyers. It is quite challenging moving home the first time, but to then find you are priced out on the next move up the ladder can be quite disconcerting, with families often having to move to a different part of town to get the bigger home they need.

Nevertheless, that’s the place many homeowners find themselves in with the cost of the additional bedroom being too much to bear. To those buying their home for the first time, all I suggest is they not only consider the mortgage payments and other costs of their first home, but also do their homework into their next rung up the Greenwich property ladder. Thinking about it now will keep you ahead of the game in the future; as your number of bedrooms, family property needs and lifestyle wants change.

..and Greenwich landlords – well these changes in the way people live also mean there are opportunities to be had in the Greenwich rental market. Many Greenwich landlords are starting to pick my brain on this, so if you don’t want to miss out – drop me a line.

Greenwich Buy-to-Let Return / Yields – 3.2% to 9.3% a year

186 v2
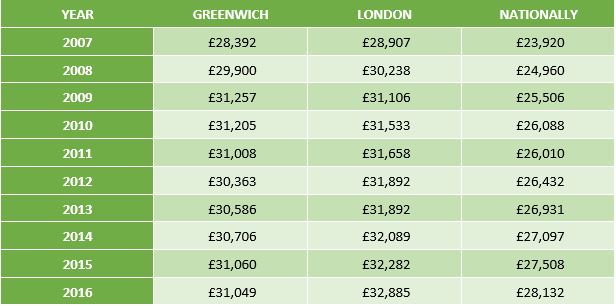
The mind-set and tactics you employ to buy your first Greenwich buy to let property needs to be different to the tactics and methodology of buying a home for yourself to live in. The main difference is when purchasing your own property, you may well pay a little more to get the home you (and your family) want, and are less likely to compromise. When buying for your own use, it is only human nature you will want the best, so that quite often it is at the top end of your budget (because as my parents always used to tell me – you get what you pay for in this world!).

Yet with a buy to let property, if your goal is a higher rental return – a higher price doesn’t always equate to higher monthly returns – in fact quite the opposite. Inexpensive Greenwich properties can bring in bigger monthly returns. Most landlords use the phrase ‘yield’ instead of monthly return. To calculate the yield on a buy to let property one basically takes the monthly rent, multiplies it by 12 to get the annual rent and then divides it by the value of the property.

This means, if one increases the value of the property using this calculation, the subsequent yield drops. Or to put it another way, if a Greenwich buy to let landlord has the decision of two properties that create the same amount of monthly rent, the landlord can increase their rental yield by selecting the lower priced property.

To give you an idea of the sort of returns in Greenwich…

Capture 1

Capture 2

Now of course these are averages and there will always be properties outside the lower and upper ranges in yields: they are a fair representation of the gross yields you can expect in the Greenwich area.

As we move forward, with the total amount of buy to let mortgages amounting to £199,310,614,000 in the country, landlords need to be aware of the investment performance of their property, especially in the era of tax increases and tax relief reductions. Landlords are looking to maximise their yield – and are doing so by buying cheaper properties.

However, before everyone in Greenwich starts selling their upmarket properties and buying cheap ones, yield isn’t the only factor when deciding on what Greenwich buy to let property to buy.  Void periods (i.e. the time when there isn’t a tenant in the property between tenancies) are an important factor and those properties at the cheaper end of the rental spectrum can suffer higher void periods too. Apartments can also have service charges and ground rents that aren’t accounted for in these gross yields. Landlords can also make money if the value of the property goes up and for those Greenwich landlords who are looking for capital growth, an altered investment strategy may be required.

In Greenwich, for example, over the last 20 years, this is how the average price paid for the four different types of Greenwich property have changed…

  • Greenwich Detached Properties have increased in value by 358.5%
  • Greenwich Semi-Detached Properties have increased in value by 329.7%
  • Greenwich Terraced Properties have increased in value by 376.2%
  • Greenwich Apartments have increased in value by 362.4%

It is very much a balancing act of yield, capital growth and void periods when buying in Greenwich. Every landlord’s investment strategy is unique to them. If you would like a fresh pair of eyes to look at your portfolio, be you a private landlord that doesn’t use a letting agent or a landlord that uses one of my competitors – then feel free to drop in and let’s have a chat. What have you got to lose? 30 minutes and my tea making skills are legendary!


29.6% Drop in Greenwich People Moving Home in the Last 10 Years

185 v2

I was having a lazy Saturday morning, reading through the newspapers at my favourite coffee shop in Greenwich.  I find the most interesting bits are their commentaries on the British Housing Market.  Some talk about property prices, whilst others discuss the younger generation grappling to get a foot-hold on the property ladder with difficulties of saving up for the deposit.  Others feature articles about the severe lack of new homes being built (which is especially true in Greenwich!).  A group of people that don’t often get any column inches however are those existing homeowners who can’t move!

Back in the early 2000’s, between 1m and 1.3m people moved each year in England and Wales, peaking at 1,349,306 home-moves (i.e. house sales) in 2002.  However, the ‘credit crunch’ hit in 2008 and the number of house sales fell to 624,994 in 2009.  Since then this has steadily recovered, albeit to a more ‘respectable’ 899,708 properties by 2016.  This means there are around 450,000 fewer house sales (house-moves) each year compared to the noughties.  The question is … why are there fewer house sales?

185 Eng and Wales Moving Graph FIXED

To answer that, we need to go back 50 years.  Inflation was high in the late 1960’s, 70’s and early 80’s.  To combat this, the Government raised interest rates to a high level in a bid to lower inflation.  Higher interest rates meant the householders monthly mortgage payments were higher, meaning mortgages took a large proportion of the homeowner’s household budget. However, this wasn’t all bad news since inflation tends to erode mortgage debt in ‘real spending power terms’.  Consequently, as wages grew (to keep up with inflation), this allowed home owners to get even bigger mortgages.  At the same time their mortgage debt was decreasing, therefore allowing them to move up the property ladder quicker.

Roll the clock on to the late 1990’s and the early Noughties, and things had changed.  UK interest rates tumbled as UK inflation dropped.  Lower interest rates and low inflation, especially in the five years 2000 to 2005, meant we saw double digit growth in the value of UK property.  This inevitably meant all the home owner’s equity grew significantly, meaning people could continue to move up the property ladder (even without the effects of inflation).

This snowball effect of significant numbers moving house continued into the mid noughties (2004 to 2007), as Banks and Building Society’s slackened their lending criteria.  [You will probably remember the 125% loan to value Northern Rock Mortgages that could be obtained with just a note from your Mum!!].  This meant home movers could borrow even more to move up the property ladder.

So, now it’s 2017 and things have changed yet again!

You would think that with ultra-low interest rates at 0.25% (a 320-year low) the number of people moving would be booming – wouldn’t you?  However, this has not been the case.  Less people are moving because:

  1. low wage growth of 1.1% per annum
  2. the tougher mortgage rules since 2014
  3. sporadic property price growth in the last few years
  4. high property values comparative to salaries (I talked about this a couple of months ago)

What does this translate to in pure numbers locally?

In 2007, 5,225 properties sold in the London Borough of Greenwich Council area and last year, in 2016 only 3,675 properties sold – a drop of 29.67%.

Capture 185

Therefore, we have just over 1,550 less households moving in the Greenwich and surrounding Council area each year.  Now of that number, it is recognised throughout the property industry around fourth fifths of them are homeowners with a mortgage. That means there are around 1,271 mortgaged households a year (fourth fifths of the figure of 1,550) in the Greenwich and surrounding council area that would have moved 10 years ago, but won’t this year.

The reason they can’t/won’t move can be split down into different categories, explained in a recent report by the Council of Mortgage Lenders (CML). So, of those estimated 1,271 annual Greenwich (and surrounding area) non-movers, based on that CML report –

  1. There are around 458 households a year that aren’t moving due to a fall in the number of mortgaged owner occupiers (e. demographics).


  1. I then estimate another 178 households a year are of the older generation mortgaged owner occupiers. As they are increasingly getting older, older people don’t tend to move, regardless of what is happening to the property market (e. lifestyle).


  1. Then, I estimate 76 households of our Greenwich (and surrounding area) annual non-movers will mirror the rising number of high equity owner occupiers, who previously would have moved with a mortgage but now move as cash buyers (e. high house price growth).


  1. I believe there are 559 Greenwich (and surrounding area) mortgaged homeowners that are unable to move because of the financing of the new mortgage or keeping within the new rules of mortgage affordability that came into play in 2014 (e. mortgage).


The first three above are beyond the Government or Bank of England control.  However could there be some influence exerted to help the non-movers because of financing the new mortgage and keeping within the new rules of mortgage affordability? If Greenwich property values were lower, this would decrease the size of each step up the property ladder.  This would mean the opportunity cost of increasing their mortgage would reduce (i.e. opportunity cost = the step up in their mortgage payments between their existing and future new mortgage) and they would be able to move to more upmarket properties.

Then there is the mortgage rules, but before we all start demanding a relaxation in lending criteria for the banks, do we want to return to free and easy mortgages 125% Northern Rock footloose and fancy-free mortgage lending that seemed to be available in the mid 2000’s … available at a drop of hat and three tokens from a cereal packet?

We all know what happened with Northern Rock …. Your thoughts would be welcome on this topic.

Decreasing Numbers of Younger Homeowners in Greenwich

184 graphic two

Charles Edwards, 38-year-old father of two from Greenwich, was out house hunting. It was a pleasant August Saturday afternoon, and our man cycles along on his bike. He cycles up a street of suburban semis, where he spots a few retired mature neighbours, chatting to each other over the garden fence. He leans his bicycle against a lamppost and launches softly into his property search.

Anyone on the road contemplating moving?” Charles asks, “I am not a landlord or developer, I’m just a Greenwich bloke trying to get out of renting, buy a house, do it up and live in it with my wife and two children

The only way I will leave here is in a box”, answers an 80-something lady, wearing her fading Paisley patterned housecoat from the 1970’s.

I‘ve lived here since before you were born, its lovely up here .. we aren’t moving, are we Doris?” (as her neighbour sagely shook his head at his wife).

Charles, like many Greenwich people born in the late 1970’s to the early 1990’s, is keen to get a slice of prime Greenwich real estate. Yet people like Charles in Generation Y (or the Millennials as some people call them i.e. born between 1977 and 1994 and needing family housing now) are discovering, as each year passes by, they are becoming more neglected and ignored when it comes to moving up the property ladder.

Looking at the graph for the UK as whole …

184 FIXED GRAPH

Over 75 percent of Brits aged 65 and above (the baby boomers) are owner-occupiers, the biggest share since records began and a proportional rise of over 48.3% since the early 1980’s. Looking at those Baby Boomers (the current 65+years old)  .. and roll the clock back 36 years (to when they were in their 30’s and 40’s and two thirds (65.6%) of them owned their own home. Whilst today, just under a half of 25 to 49 years old (47.3%) own their own home.

However, the biggest drop has been in the 18 to 24-year old’s, where home ownership has dropped from a third (32%) in the 1980’s to less than one in ten (8.9%) today. Looking at the Greenwich statistics, the numbers make even more interesting reading.

capture 184

Capture 2 184

Government policy contributes to the generational stalemate. Stamp Duty rules prevent older Brits from moving as the price of land and planning rules make it harder to build affordable bungalows that are attractive to members of the older generation who want to move.

The average value of an acre of prime building land in the UK is between £750,000 and £800,000 per acre. Bungalows are the favoured option for the older generation, but the problem is bungalows take up too much land to make them profitable for new homes builders. The housing market is gridlocked with youngsters wanting to get on (then move up) the property ladder whilst the older generation, who want to move from their larger houses to smaller, more modern bungalows, can’t. The problem is – there simply aren’t enough bungalows being built and the high price of land, means they are prohibitive to build.

So, what is my point? Well, all I would say to the homeowners of Greenwich is that one solution could be to start to talk to your local councilors, so they can mould the planners’ thoughts and the local authority thinking in setting land aside for bungalows instead of two up two down starter homes? That would free the impasse at the top of the property ladder (i.e. mature people living in big houses but unable to move anywhere), releasing the middle aged gridlocked people in the ladder to move up, thus releasing more existing starter homes for the younger generation.

… and to you Charles … the wandering new home searcher – if things are going to change, it will be years before they do .. so keep going out and spreading the word of your search for a new home for your family.


Slowing Greenwich Property Market? Yes and No!

183 pic 1

My thoughts to the landlords and homeowners of Greenwich…

The tightrope of being a Greenwich buy-to-let landlord is a balancing act many do well at. Talking to several Greenwich landlords, they are very conscious of their tenants’ capacity and ability to pay the rent and their own need to raise rents on their rental properties (as Government figure shows ‘real pay’ has dropped 1% in the last six months). Evidence does suggest many landlords feel more assured than they were in the spring about pursuing higher rents on their properties.

During the summer months, historic evidence suggests that the rents new tenants have had to pay on move in have increased. June/July/August is a time when renters like to move, demand surges and the normal supply and demand seesaw mean tenants are normally prepared to pay more to secure the property they want to live in, in the place they want to be. This is particularly good news for Greenwich landlords as average Greenwich rents have been on a downward trend recently. So look at the figures here…

Capture 1

Rents in Greenwich on average for new tenants moving in have risen 2.6% for the month, taking overall annual Greenwich rents 0.6% lower for the year

However, several Greenwich landlords have expressed their apprehensions about a slowing of the housing market in Greenwich. I think this negativity may be exaggerated.

Before we get the Champagne out, the other side of the coin to property investing is capital values (which will also be of interest to all the homeowners in Greenwich as well as the Greenwich buy-to-let landlords).  I believe the Greenwich property market has been trying to find some level of equilibrium, with property prices easing back slightly since the New Year.  According to the Land Registry…

Property Values in Greenwich are 3.1% lower than they were 12 months ago, dropping by 2.6% last month alone!

Yet, I would take those figures with a pinch of salt as they reflect the sales of Greenwich properties that took place in early Spring 2017 and now are only exchanging and completing during the summer months.

The reality is the number of properties that are on the market in Greenwich today has risen by 5.47% since the New Year and that will have a dampening effect on property values. As tenants have had less choice, buyers now have more choice … and that will temper Greenwich property prices as we head towards 2018.

Be you a homeowner or landlord, if you are planning to sell your Greenwich property in the short term, it is crucial, especially with the rise in the number of properties on the market, that you realistically price your property when you bring it to the market … with the increase in choice of properties, the balance of power during negotiation generally sways towards the buyer. Given that everyone now has access to property details, including historic stats for how much property have sold for, they will be more astute during the offer and negotiation stages of a purchase.

However, even with this uplift in the number of properties for sale in Greenwich, property prices will remain stable and strong in the medium to long term. This is because the number of properties on the market today is still way below the peak of summer of 2008, when there were 1,188 properties for sale compared to the current level of 626 (if you recall, prices dropped by nearly 20% in Credit Crunch years of ‘08 and ‘09).

183 pic v2

Compared to 2008, today’s lower supply of Greenwich properties for sale will keep prices relatively high…and they will continue to stay at these levels for the medium to long term.

Less people are moving than a few years ago, meaning less property is for sale. Fewer properties for sale mean property prices remain relatively high and this is because of a number of underlying reasons. Firstly, buy-to-let landlords tend not sell their properties as often than owner-occupiers, consequently removing the property out of the housing market selling cycle. Secondly, Stamp Duty is much higher compared to 10 years ago (meaning it costs more to move). Next, there is a dearth of local authority rental housing so demand for private rented housing will remain high. Then we have the UK’s maturing owner occupier population, meaning these older people are less likely to move (compared to when they were younger). Another reason is the lack of new homes being built in the country (we need 240k houses a year to be built in the UK and we are currently only building 145k a year!) and finally, the new mortgage rules introduced in 2014 about how much a person can borrow on a mortgage has curtailed demand.

Some final thought’s before I go – to all the Greenwich homeowners that aren’t planning to sell – this talk of price changes is only on paper profit or loss. To those that are moving … most people that sell, are buyers as well, so as you might not get as much for yours, the one you will want to buy won’t be as much, (swings and roundabouts as Mum used to say!)


To all the Greenwich landlords – keep your eyes peeled – I have a feeling there may be some decent buy-to-let deals to be had in the coming months. One place for such deals, irrespective of which agent is selling it, is my Greenwich Property Blog .https://greenwichpropertyblog.co.uk/